The Omitted Variable
How does a disproven empirical model still drive our inflation modeling?

Top Comment
Tom Adkins calls in from the non-profit sector:
For my sins I work with the non-profit sector, AND with non-profit sector data. This article triggered a memory of a report I read some months ago that showed that the religious/grant-making sector was hit particularly hard by the pandemic/great resignation, and has been, by a surprisingly large amount, the slowest non-profit sub-sector to recover in terms of employment. Here it is:
Why has this sector been hard hit? We think of these jobs as community- and service-oriented and intrinsically rewarding, so it’s hard to mentally place them in the same category as the retail, leisure, and caregiver jobs that people left during the great resignation. But I’ve seen a number of small, independent non-profits face exactly the same pressures, as, say, restaurants and nursing homes. This is part-time, low-wage work at orgs that can't afford to increase the paycheck, and people can’t afford to do anymore.
Add to that, the non-profit sector tends not pay as much as the for-profit sector for similar work. And the part-time operations/IT/accounting jobs that run your local church may not have been all that rewarding in the first place. "Jobs Hard to Fill," indeed. It makes sense these jobs haven't come back -- or rather people haven't come back to them.
MWG responds:
Tom, thank you for the comment. Your sins are forgiven for your service to YIGAF. Go forth and sin no more…
Seriously, it's a very useful addition. Note that the report has an interesting footnote in regards to “Religious, grantmaking, civic, professional” nonprofit jobs which according to the report had only recovered 31% of the jobs lost during Covid while the aggregate nonprofit sector rose to new heights:
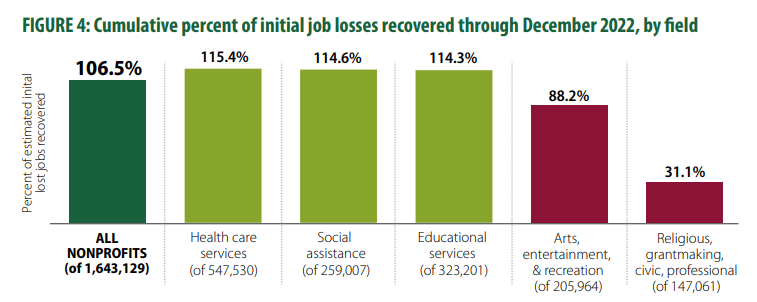
“This field was significantly affected by the 2021 BLS annual benchmarking process. As part of this process, the seasonal adjustment models are also updated. As a result, some large revisions to seasonally-adjusted data occurred with the updated models, reducing employment in this field by more than 183,000 workers. It is unclear why this field was affected in this way; as such, we have included this change in the analysis without revision.”
As noted in Uber Alles, this is one of only a few sectors NOT subject to the reliance on the administrative unemployment insurance reporting in QCEW and the Birth/Death model. Perhaps it’s just me, but when nonprofit experts write a report on job losses and can’t figure out WHAT changed in BLS methodology, maybe the rest of us should sit up and take notice of the divergence.
Main Event
My apologies for skipping last week’s note. I was swamped this week with the Simplify Entering the Fall conference and speaking at Grant’s Interest Rate Observer conference. I was also not particularly happy with the writing, so I held off. This week you get a double issue.
As you might guess, this post returns to the topic of inflation, which is receiving renewed attention in light of the now-suspended longshoreman strike and fears of escalation in the Middle East. I share some of my views on why inflation did indeed prove transitory hope that we can soon move on from a poor understanding of inflation drivers. At the end of the piece, I discuss some recent updates to equity market valuation and passive influence with a brief discussion of the recent Shanghai rally.
Part of the impetus for a discussion of inflation is simply the timeliness. As predicted in Just A Little Bit Louder Now, the seasonally driven improvement in inflation metrics that accelerated the summer decline in inflation has begun to abate with inflation marginally higher than expectations. This was entirely driven by the lagging shelter component, which “unexpectedly” turned modestly higher due to seasonal adjustments. As a reminder, the seasonal adjustments will continue to get less favorable as we progress through the year, even as underlying inflation likely continues to retreat.

At the core of most models of inflation sits the Phillips Curve, the presumed relationship between inflation and unemployment articulated by Kiwi economist Bill Phillips in 1958. Like the 2% inflation targeting originating in New Zealand, it has become a “just because” model corrupted beyond its original intention. Phillips's initial formulation was not “inflation,” but wage inflation:
“The purpose of the present study is to see whether statistical evidence supports the hypothesis that the rate of change of money wage rates in the UK can be explained by the level of unemployment and the rate of change of unemployment, except in, or immediately after, those years in which there was a very rapid rise in import prices.” — Phillips, 1958
Since wage inflation was presumed to be the primary driver of inflation, this model was non-empirically extended to its present incarnation as Unemployment → Inflation

Mitchell’s original formulation appears to have some predictive power. However, it is not a model of inflation. It is a classic “commodity pinch point” relationship, where levels of available supply (inventory as % of demand) determine whether the commodity is in surplus or deficit (X-axis) and therefore price rationing (wage “inflation”) is used to match supply and demand. We can run nominal and real variants of the model to test this hypothesis. Please note that I have excluded the COVID period from both data sets to improve results.

Note that the r-sq for REAL wages is far higher (but still modest) than the r-sq for nominal wages. This makes perfect sense if you consider labor supply/demand to be a REAL constraint in the economy, but ZERO sense if you believe wages CAUSE inflation. The extension of the Phillips model to Unemployment → Inflation has almost zero predictive value:

This is not new news:
Mehra (1991), Hu and Trehan (1995), and Gordon (1998) report evidence that indicates wage growth has no predictive content for future inflation. — Mehra, 2000
In contrast, inflation always helps predict future wage growth, this result holding in all subperiods. — Mehra, 2000
So what happens when the Federal Reserve decides that, despite all empirical evidence, wages do cause inflation? Unsurprisingly, policy then places an upper limit on wage growth while no such limit exists on corporate profits. Hilarity ensues:

Policy aside, modern economics solved this problem of zero predictive value by introducing “expectations” — arguing that inflation is a function of unemployment augmented by inflation expectations with an “inertia” factor associated with trailing inflation and unemployment adjusted for the non-observable “NAIRU” (non-accelerating inflation rate of unemployment). Got it?
What are expectations? Well, we don’t really know… but we can attempt to use survey measures to estimate them — and they do appear to predict inflation (blue)… but they also are largely indistinguishable from current period inflation (orange)! Averaging the two, which many “sophisticated” models of inflation attempt to do by incorporating BOTH terms, appears to cancel out errors in both directions and produces the highest R-sq.

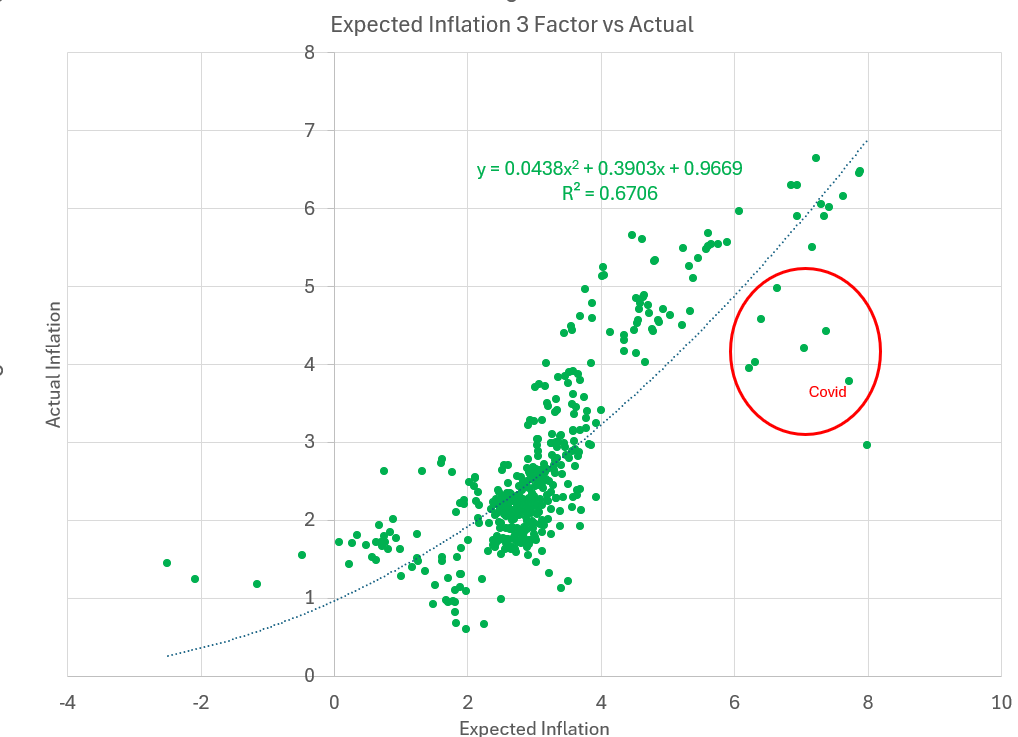
OK, so now we appear to have something… a 3-factor model that uses (1) the average of trailing core inflation AND expectations, (2) Unemployment, and (3) Change in Unemployment. Admittedly this last factor is unknowable in advance, but we can certainly make estimates. This 3-factor model would have done a reasonable job, but as Larry Summers could tell you, suggested inflation was going to rise MUCH more than we actually saw in Covid and be very hard to reverse. In fact, he DID tell you that:

The traditional formulation for inflation projections made this clear:
Now it’s easy to poke holes in hindsight, but my readers may remember that I was on the opposite side of the equation. While I expected inflation in the aftermath of Covid, I am a perennial “team trans” as my partner Harley Bassman likes to note. Why? Because of the omitted variable of labor force growth:

While the single most predictive variable for inflation is, as noted above, inflation itself, the BEST predictor for PERSISTENCE of inflation is labor force growth. Why? Because labor is not primarily a measure of supply, it’s a measure of demand. When we have periods like the 1970s when the labor force is growing at over 3% a year, that means the supply of goods and services AND capital must grow by at least 3% a year to prevent shortages for new labor force entrants and keep us on the production possibilities frontier. Each year growth fails to achieve that hurdle leaves you further and further behind the curve. The 1960s and 70s did indeed have a component of guns and butter, but at the core was simply the global Baby Boom combined with an artificial resource shortage created by reliance on imported oil.
Why Does This Matter?
We are in an odd place. Inflation has fallen, but fear of inflation is high. The theory of “waves of three, beware of thee” is almost as accepted as poison oak. And we can see inflationistas grasp at every available straw — “Port strike!” being but the latest. But models of inflation that have predicted incipient inflation at every turn for the past two decades need to be retired. And models of inflation that overindex on population/labor force growth (as mine did) need to be updated. How can we update them? Well, certainly not by adopting nonsense models of “aging populations are inflationary” as the now-forgotten Charles Goodhart advocated and the eventually-to-be-forgotten Michael Green eviscerated in July of 2023. But it should be clear that the bias is lower inflation, not higher. For heaven’s sake, Italy (Italy!) just reported 1% inflation.

So what did happen to cause the gap between the four-factor model and actual inflation?

My assessment is similar to the “Greedflation” narrative — when faced with the opportunity to raise prices due to increased inflation volatility and acknowledged cost uncertainty, many corporations did. Robert Hall’s March 2023 paper made it painfully clear what was underway. As a seller, a price change is an opportunity for consumers to re-evaluate. If a single seller raises prices, then competitors have the opportunity to gain share. If markets are NOT competitive, i.e., if shortages emerge or industries have consolidated/collaborated, then sellers can follow the leader into an economically under-supplied market and raise prices en masse. The consumer has no choice but to spend more while getting less.

Unfortunately, this “excess” inflation of ~2% is almost perfectly explained by the increase in corporate profits as a percent of GDP.

