The Rhythm of the Night...
Despite increasingly confusing overnight price behavior, correlations continue to increase
There is much to talk about this week, ranging from the imminent forced acquisition of First Republic, to the “Why are you reading this now?” confession that the SF Fed failed in its regulatory capacity, to a rip-roaring end-of-week rally that managed to take Microsoft (MSFT) valuations back above pre-pandemic highs despite risk-free rates that have more than doubled.
“I’ll make him an offer he can’t refuse” applies to both FRC management and the acquiring banks in a replay of the strong-arming of the GFC. A simple warning that the regulators are pushing more onto the private sector already. Unlike SVB, they desperately want a private sector solution for the failure of the 14th largest bank in the United States. This is the inevitable arc -- easy political solutions to harder private sector solutions to hard political solutions with consequences. We have yet to reach Stage 3, but it will come.
Mary Daly is almost certainly out at the San Francisco Fed. Her grandstanding empathy on the impact of inflation was enough to draw attention to this Fed insider. That she is now being hung out to dry suggests blame deflection is underway. Far easier to hit “Ms. I Don’t Feel Inflation” than admit that Jay Powell went rogue… for now.
But the real story of the week has to be the performance of Microsoft which just concluded the single greatest three months of market capitalization gain in its history, adding almost exactly $500B in market cap since January 30th. Nearly the entire capitalization of Bitcoin ($568B) for those keeping track.
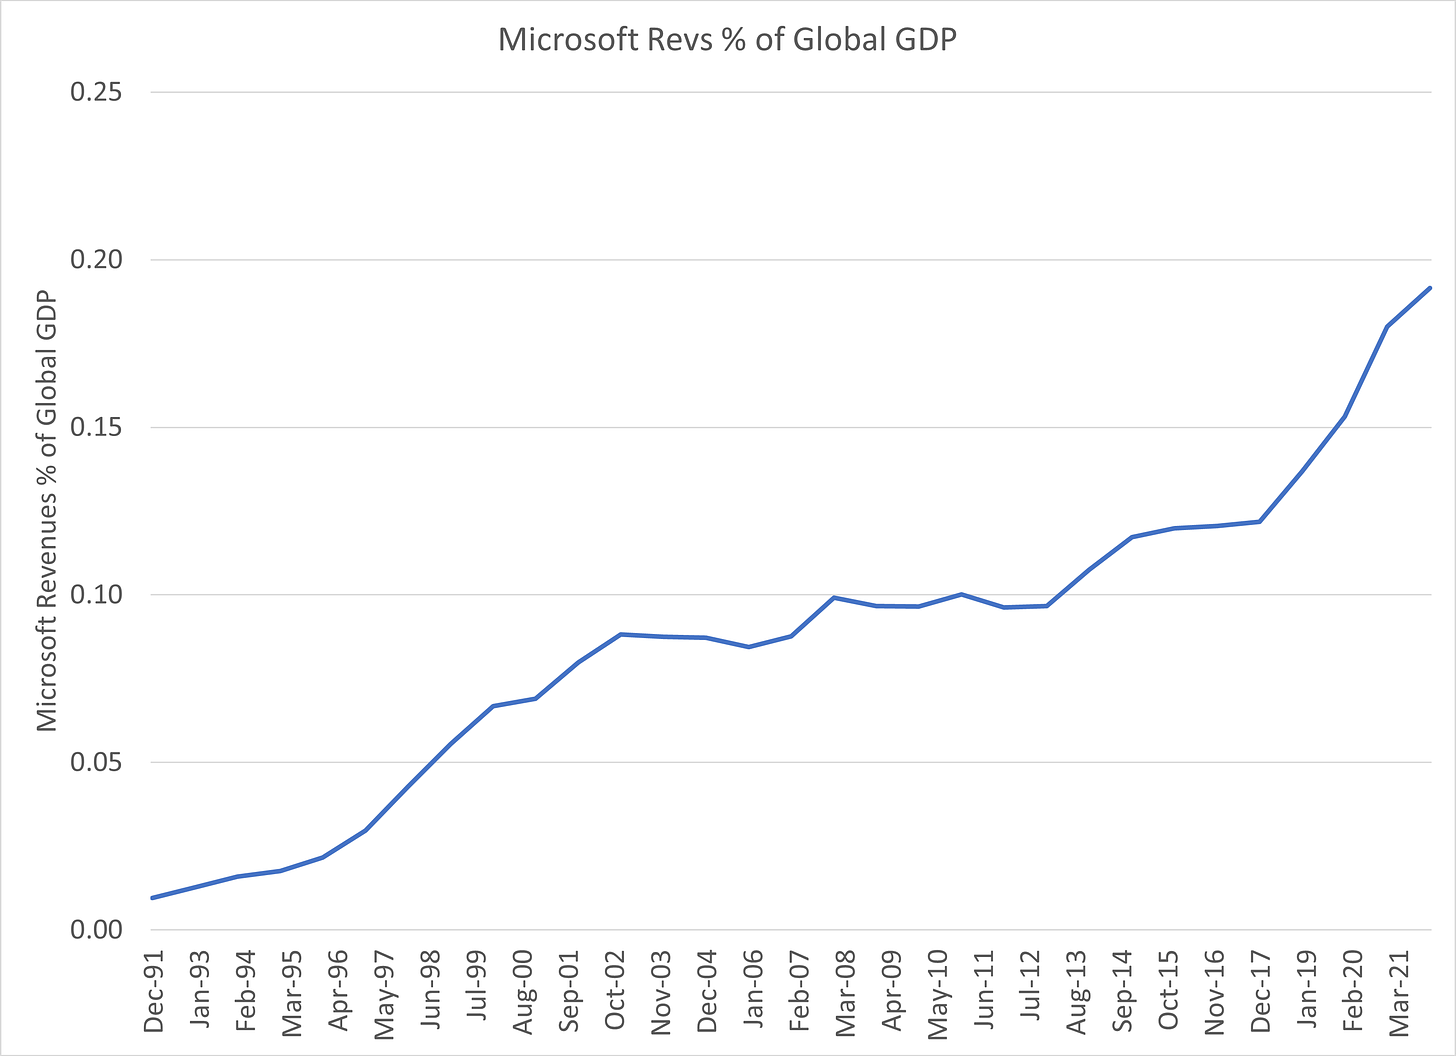
Now leaving aside the simple fact that Microsoft GAAP EPS were down nearly 20% YoY, the pattern of extraordinary volatility has to be concerning. It’s frankly absurd that a company with a revenue line modestly exceeding the GDP of Greece should experience this type of asset pricing uncertainty. In fact, on any reasonable metric, MSFT is the paragon of (growth) stability:
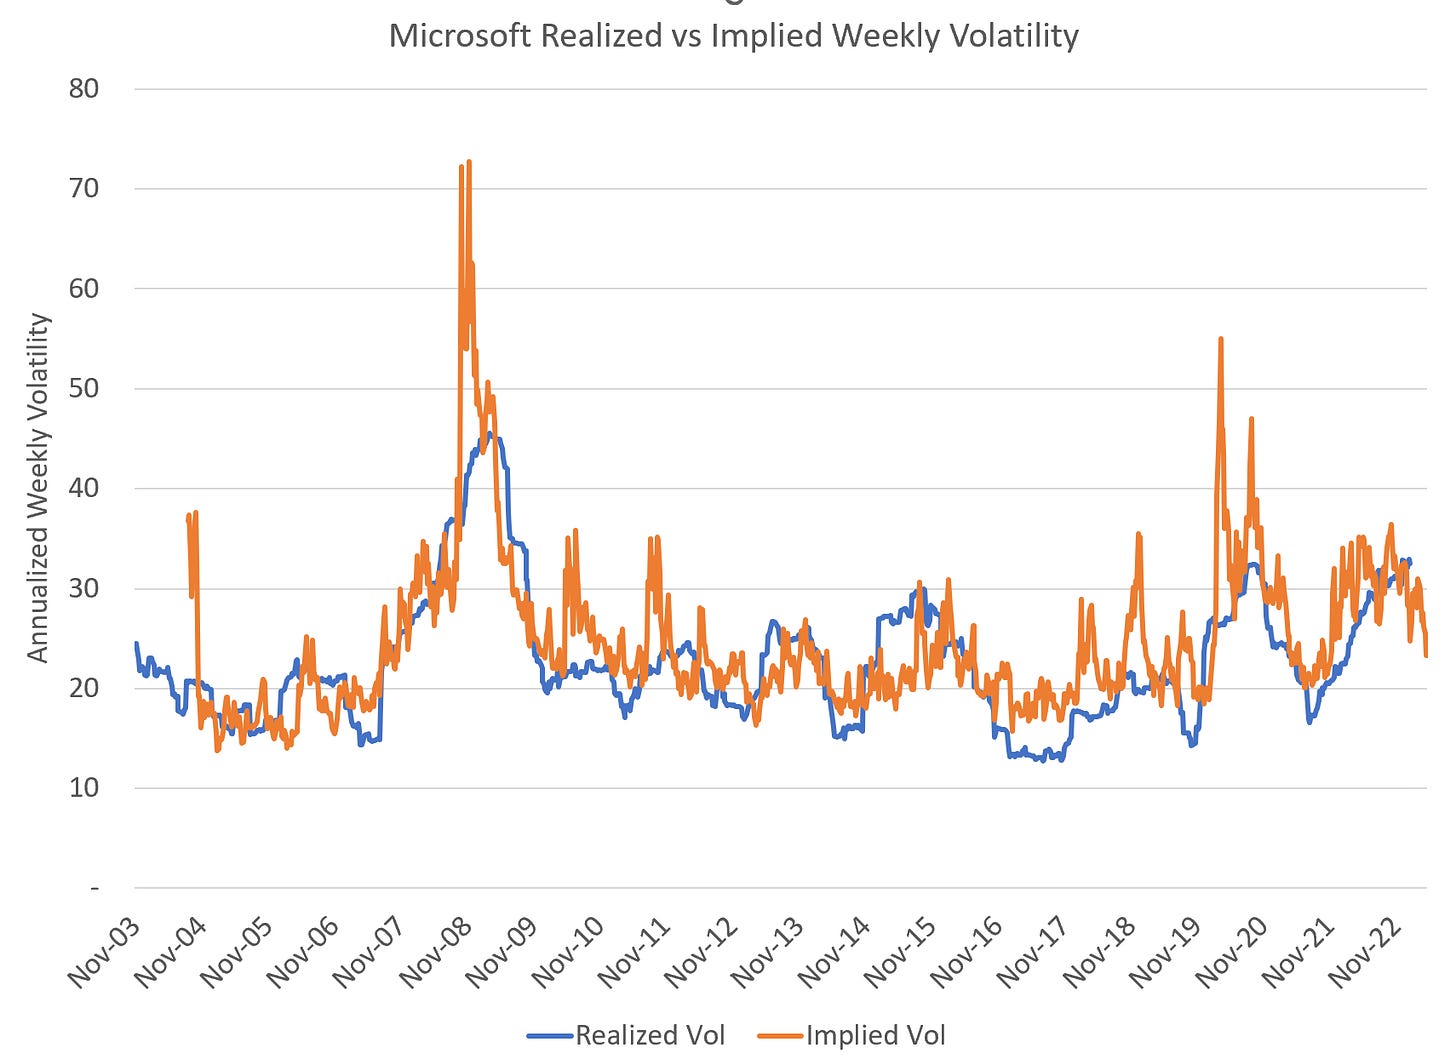
In general, options dealers do a fantastic job of pricing forward implied vol. Since 2003, despite Microsoft delivering one of the greatest returns in market history (1,680% cumulative total return), Microsoft options implied vol has exceeded realized over 65% of all three month periods.
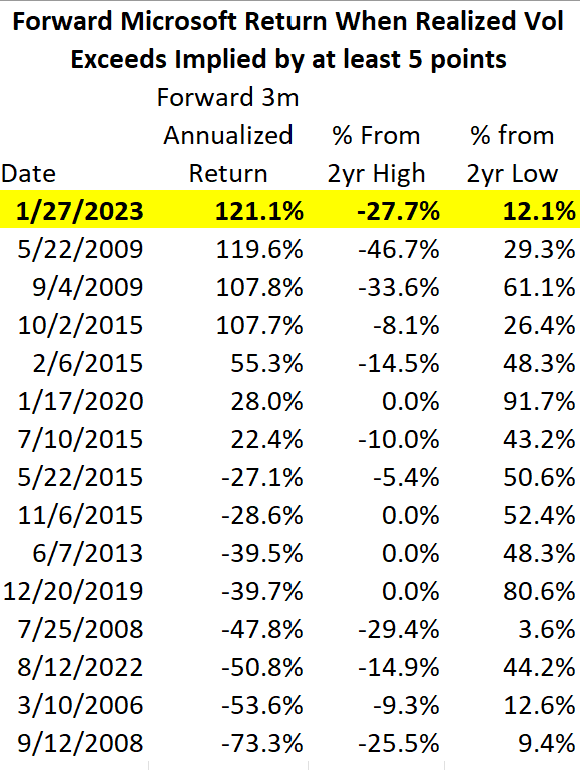
This was not one of those periods. In hindsight, Microsoft three month call options were possibly the greatest value in the firm’s history at the end of January 2023, exceeding even the aftermath of the GFC. The annualized price return of 121% tops all comers when taking implied vol into account:
Unfortunately, Microsoft is actually the poster child for the errors in theory of passive investing. For instead of becoming more stable as it grows in market cap, we are seeing that market liquidity does not scale with market capitalization. Jean-Phillippe Bouchaud writes eloquently (if mathematically) on this subject in his analysis of the Gabaix & Koijen paper, The Inelastic Market Hypothesis, the similarly titled “The Inelastic Hypothesis: A Microstructural Interpretation”:
We show that the Latent Liquidity Theory of price impact makes a precise prediction for GK’s multiplier M, which measures by how many dollars, on average, the market value of a company goes up if one buys one dollar worth of its stocks. Our central result is that M is of order unity, as found by GK, and increases with the volatility of the stock and decreases with the fraction of the market cap. traded daily. We discuss several empirical results suggesting that the lion’s share of volatility is due to trading activity. We argue that the IMH holds for all asset classes, beyond the case of stock markets considered by GK
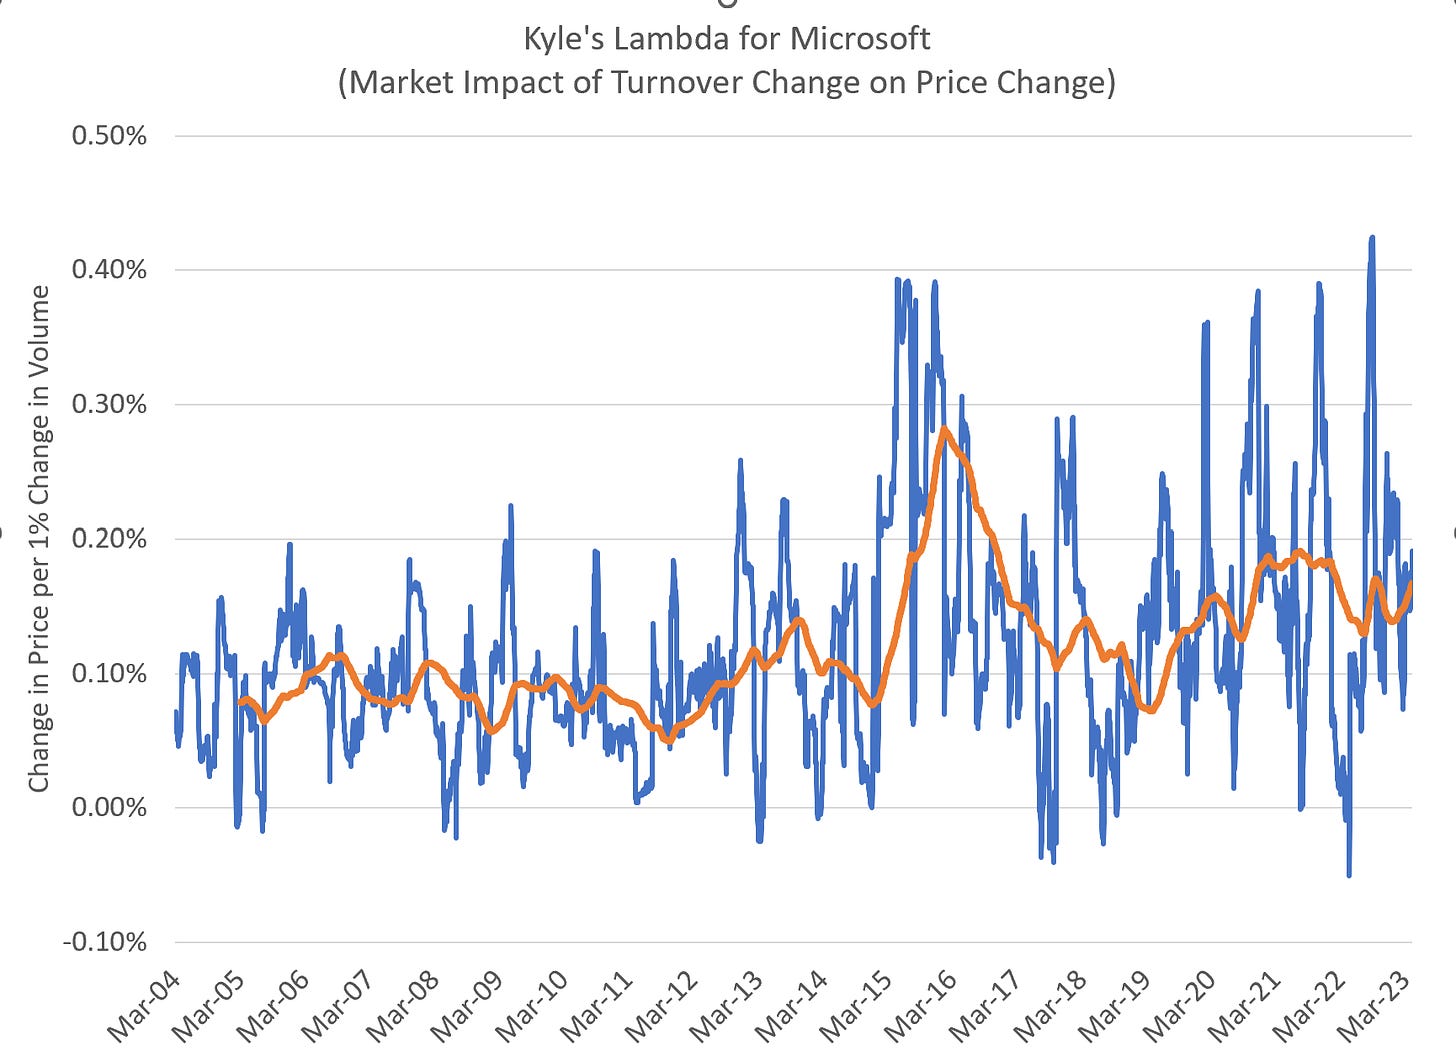
Metrics of “market impact” suggest that changes in volume are having LARGER impacts on stock prices over time, in contrast to the EMH assumption that these metrics should be largely stable:
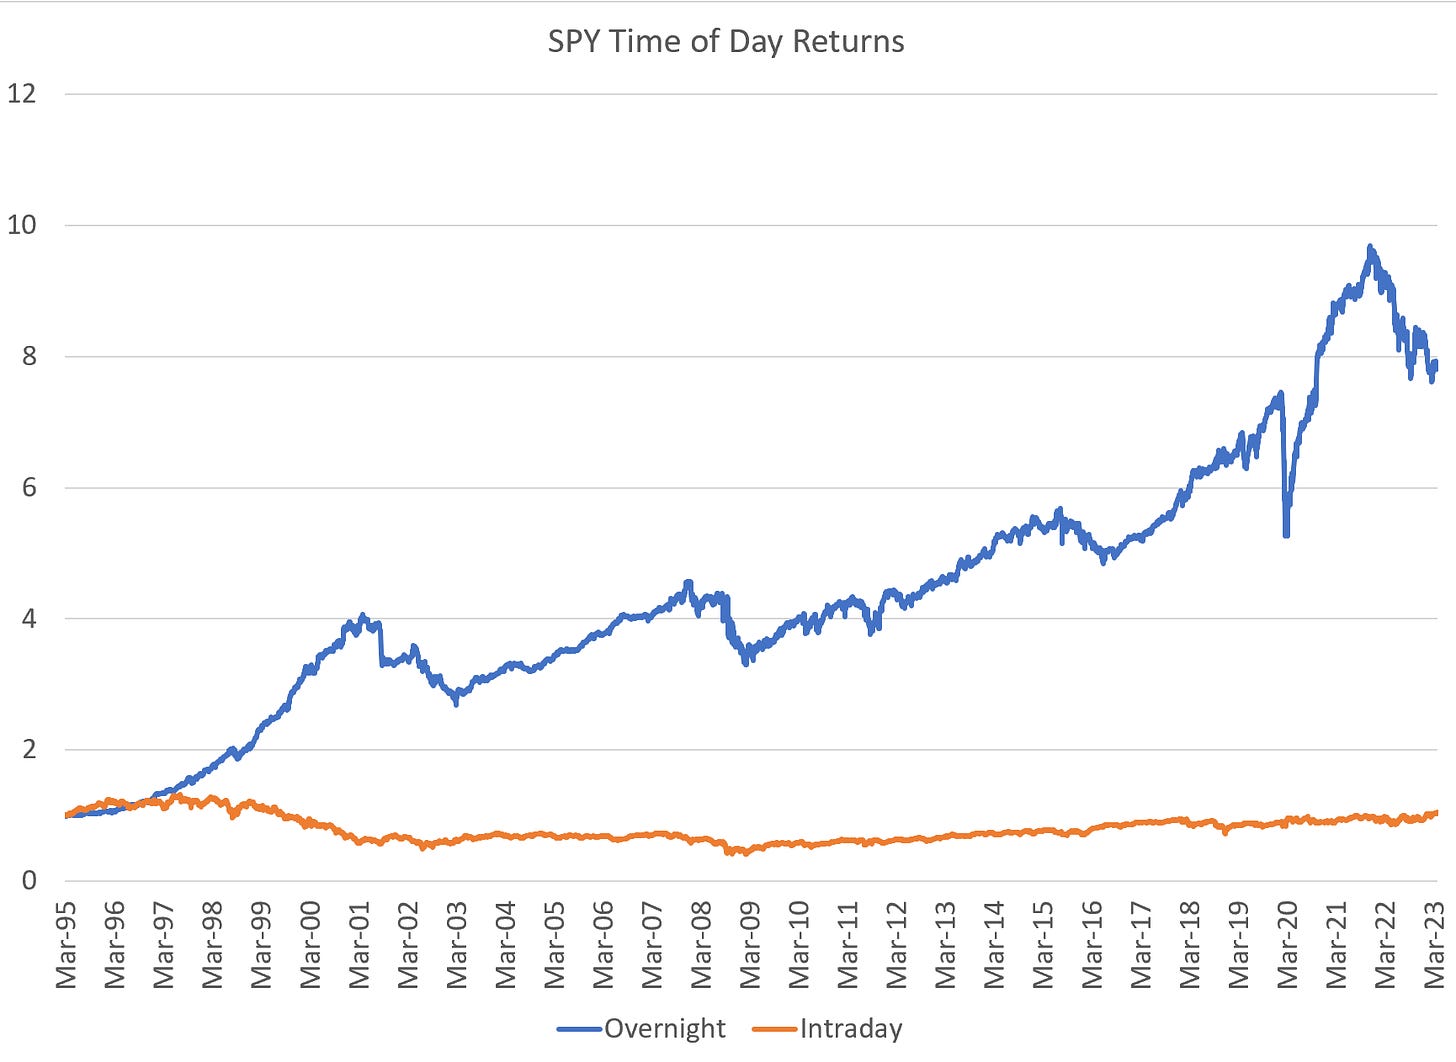
We are also seeing increasingly bizarre behavior in the relatively thin overnight session. Most are familiar with the odd dynamics of “time of day” returns. Since the introduction of the SPY ETF, 100% of returns have occurred in the overnight session:
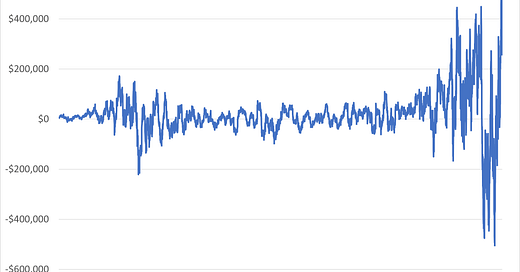
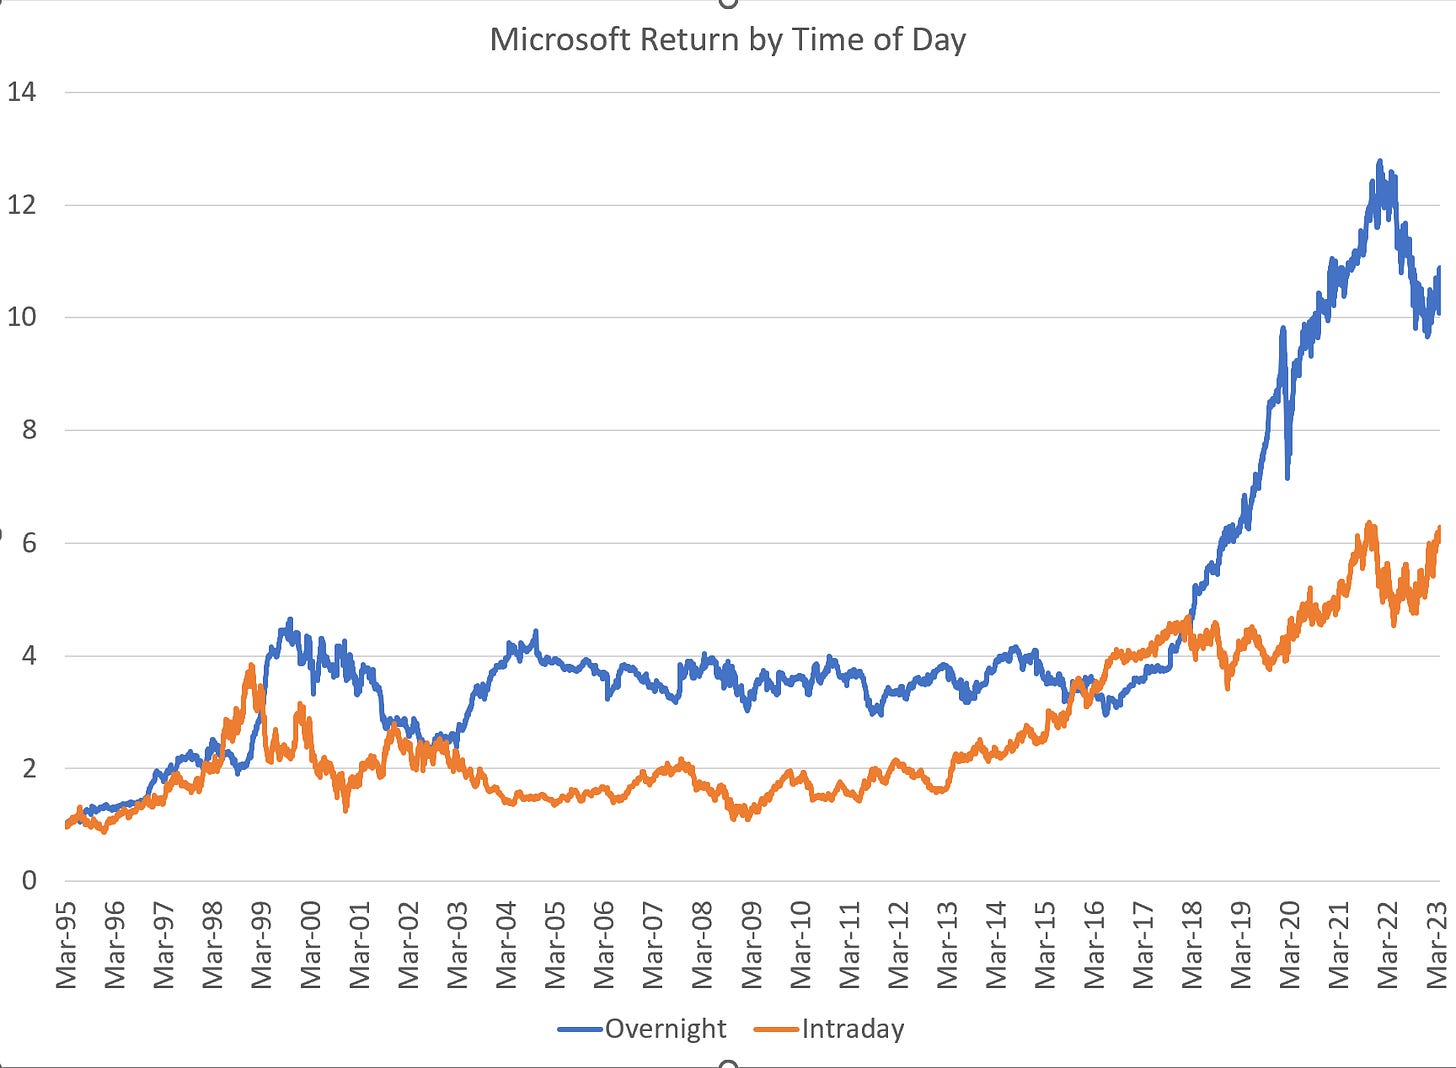
However, looking at MSFT, these same results don’t hold. In fact, MSFT returns were flat overnight from 1999 until 2016, and then began rising after 2016:
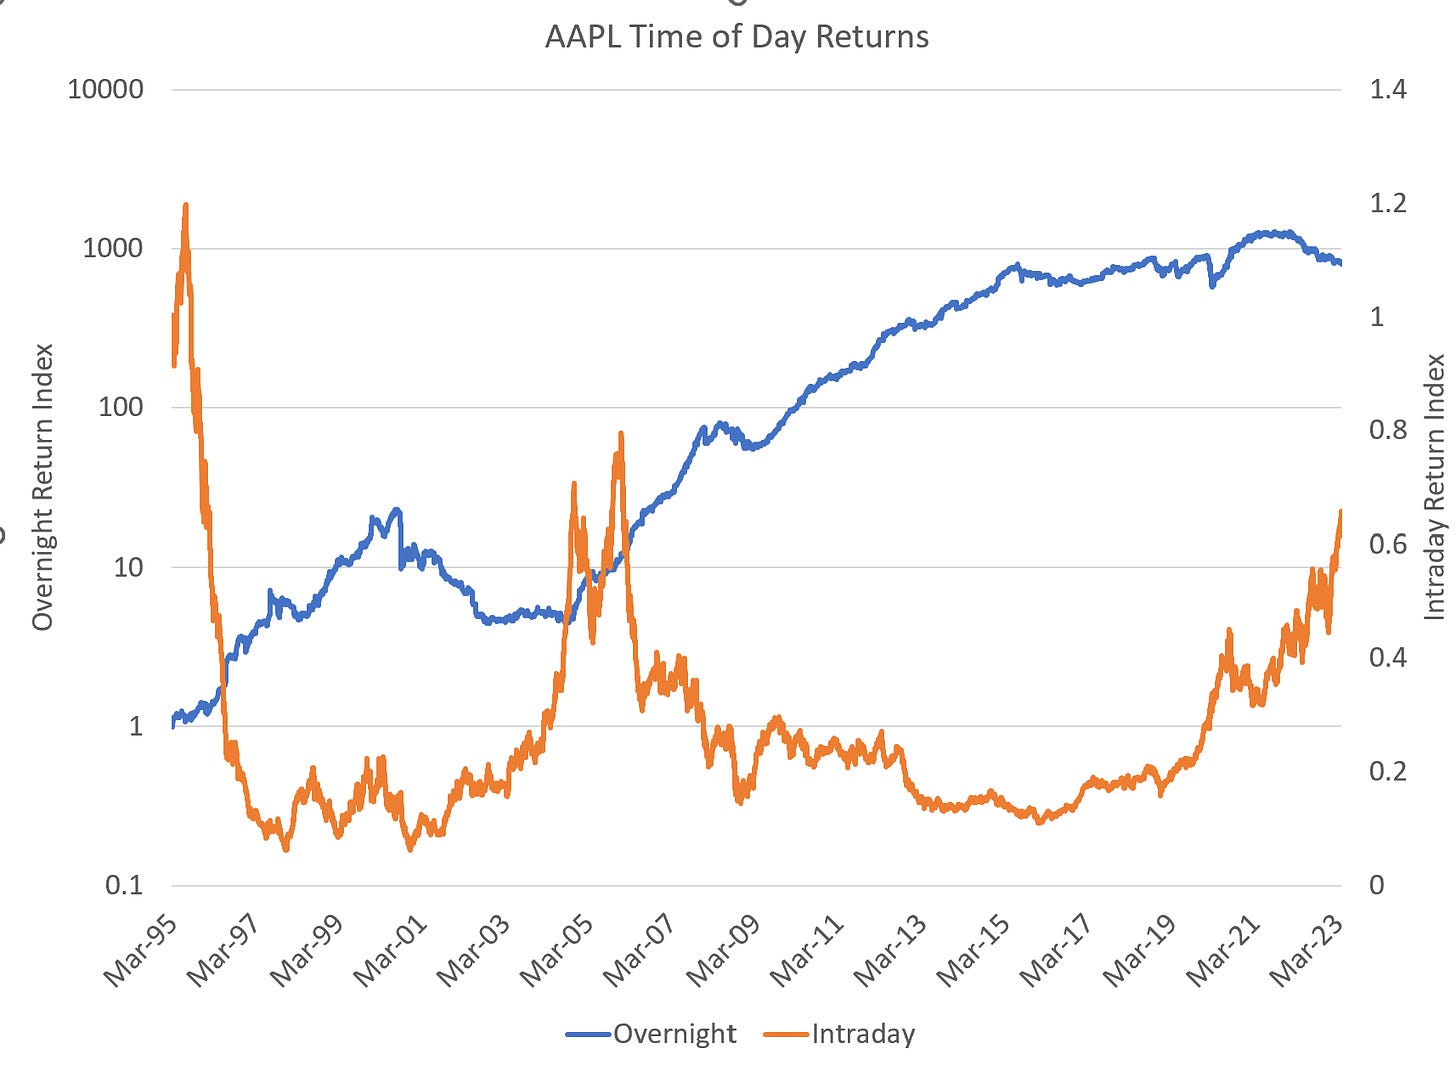
In contrast, AAPL returns show almost the exact opposite pattern — rising overnight until 2016 and then largely stable. After rising 800x from 1995 until 2015, while falling in the intraday session for most of that period, the pattern has oddly flipped. Since July 2015, AAPL stock is flat overnight while rising during the day:
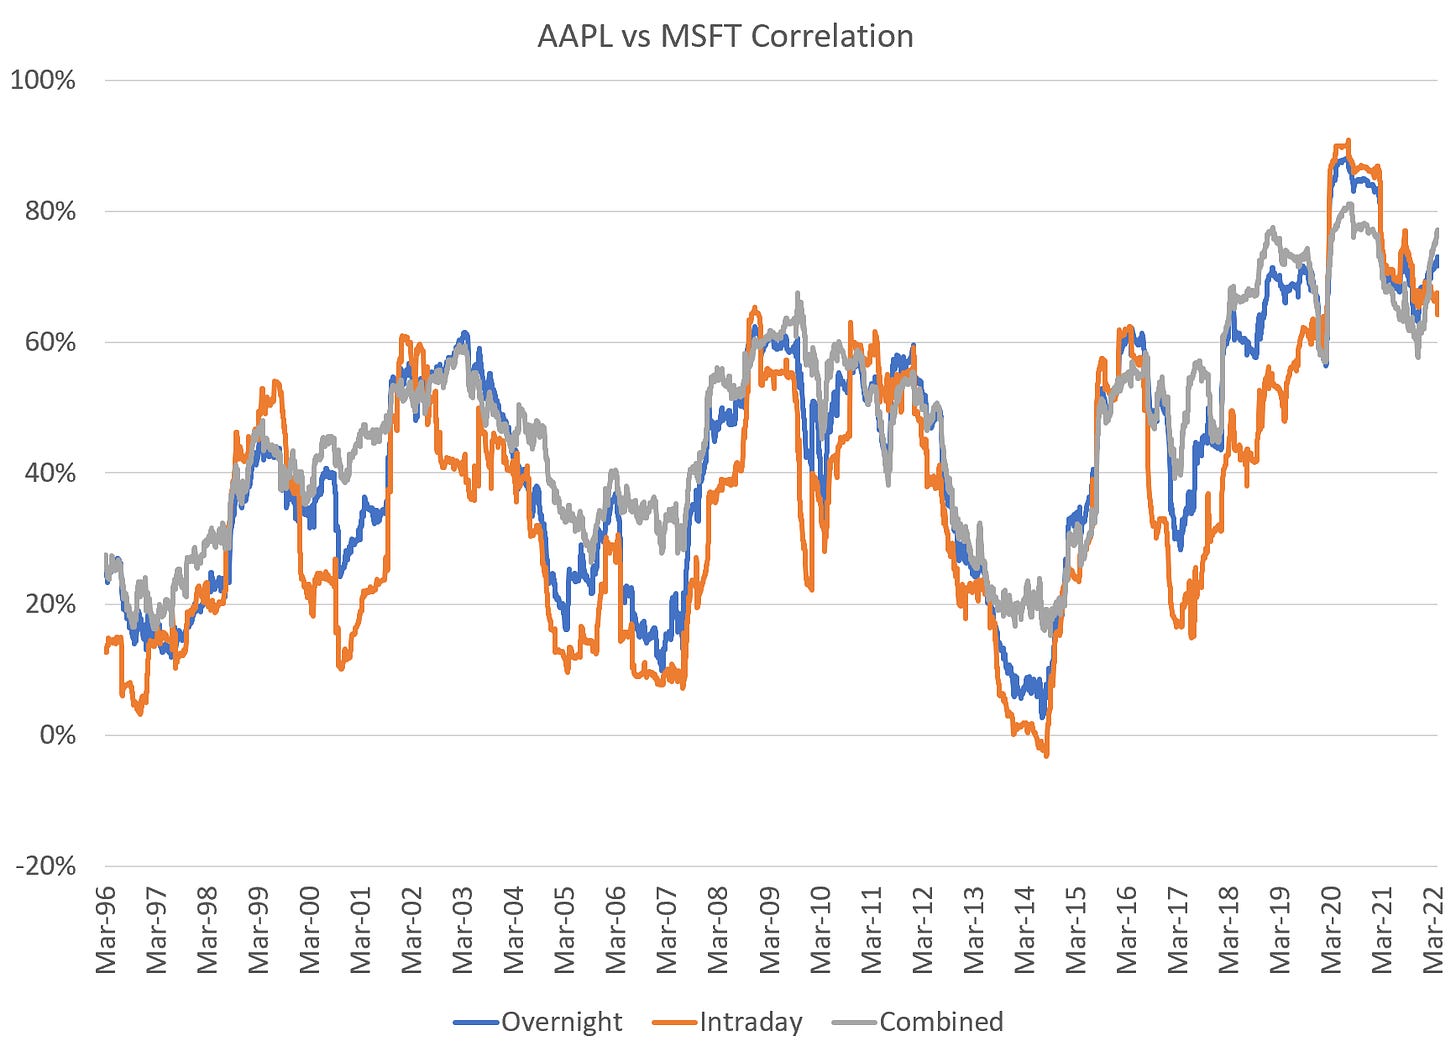
What gives? Candidly I don’t know. This does not match a pattern of earnings beats, new product introductions, or really even aggregate market behavior. Nor for that matter does this flip suggest that the stocks are becoming less correlated. In fact, the exact opposite is occurring — recent levels of correlation are the highest on record if we adjust for the intraday and overnight sessions:
I’m certainly open to interpretation. My assumption is that the increase in correlation post-2015 has everything to do with the growth of passive strategies, but I’m open to alternatives. It’s a remarkable shift.
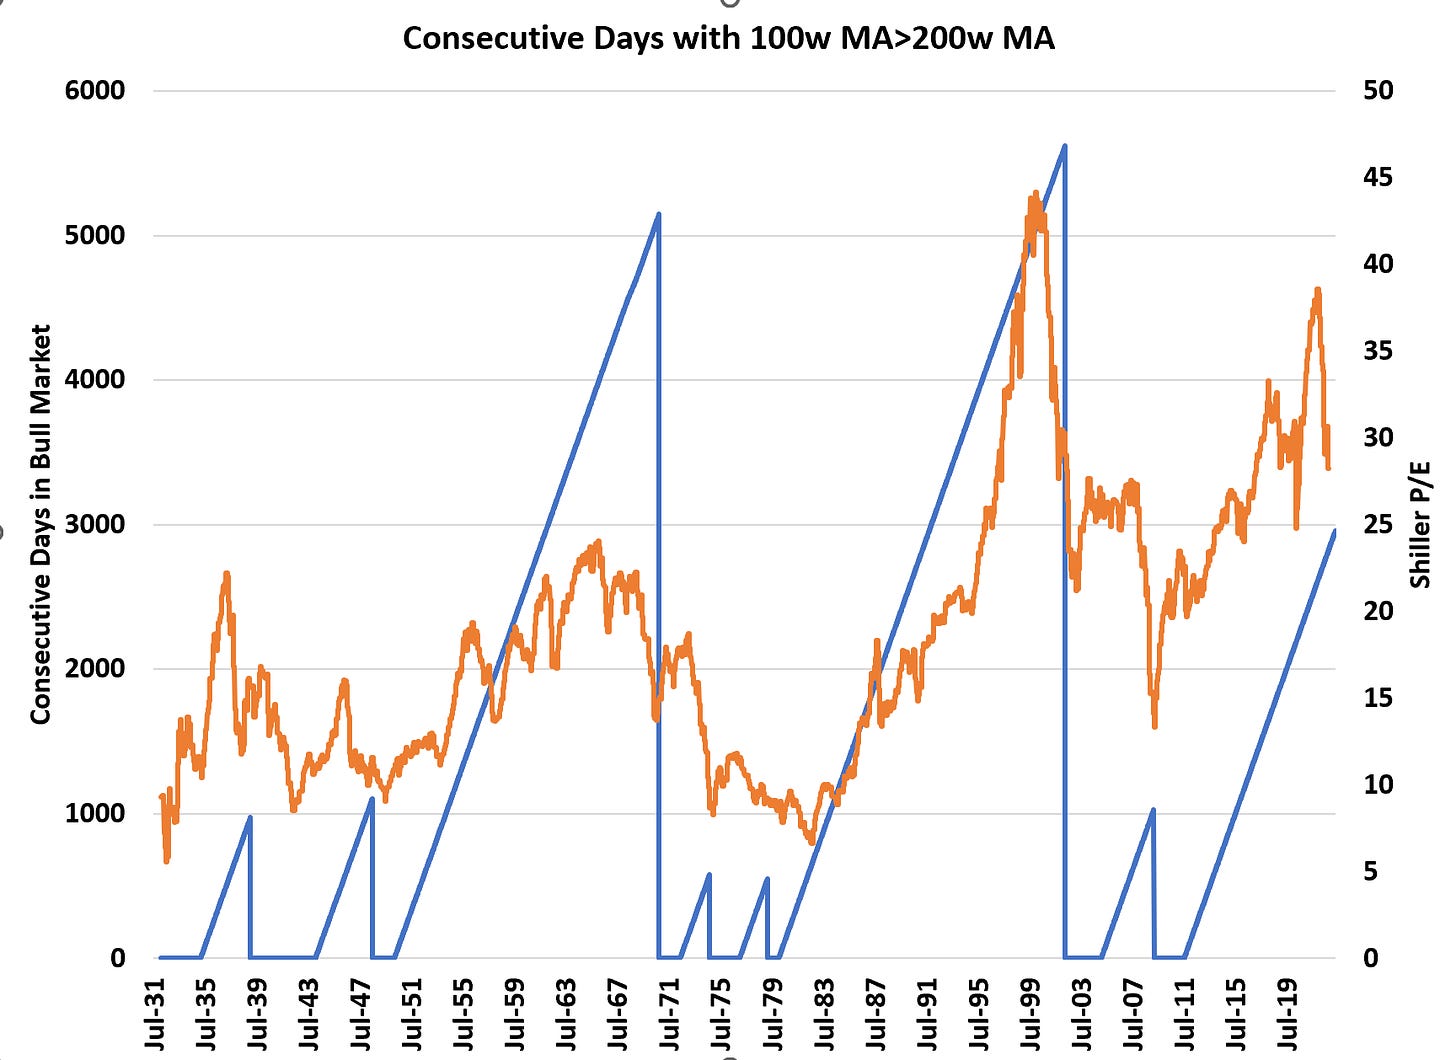
Meanwhile, while the S&P500 fell into a bear market during COVID and again during 2022 based on the classic “down 20%” metric, both were remarkably brief. A more generous interpretation of “bear market” might be something like “the 200 week moving average falls below the 100 week moving average” (4 year below 2 year). On this basis, there has been no bear market which much more broadly fits with the continued increase in valuations. Shiller P/Es tend to roughly follow this looser definition of bull and bear markets:
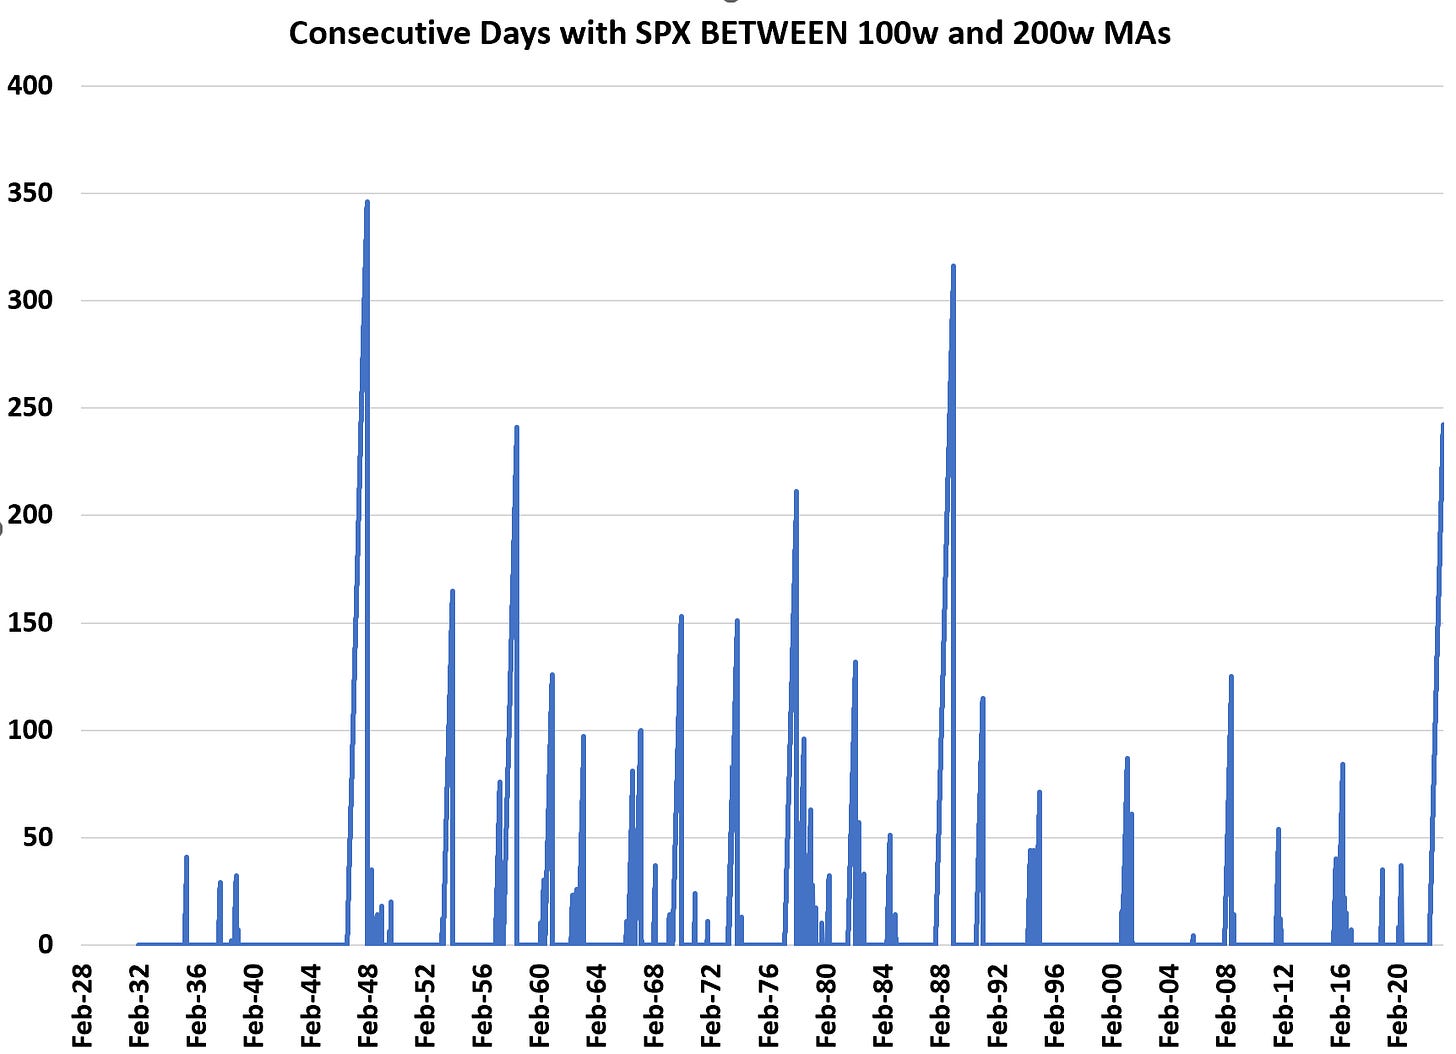
This takes on a measure of urgency as the S&P500 has been consolidating BETWEEN these two levels for almost a full year now (242 days) — the third longest consolidation in history:
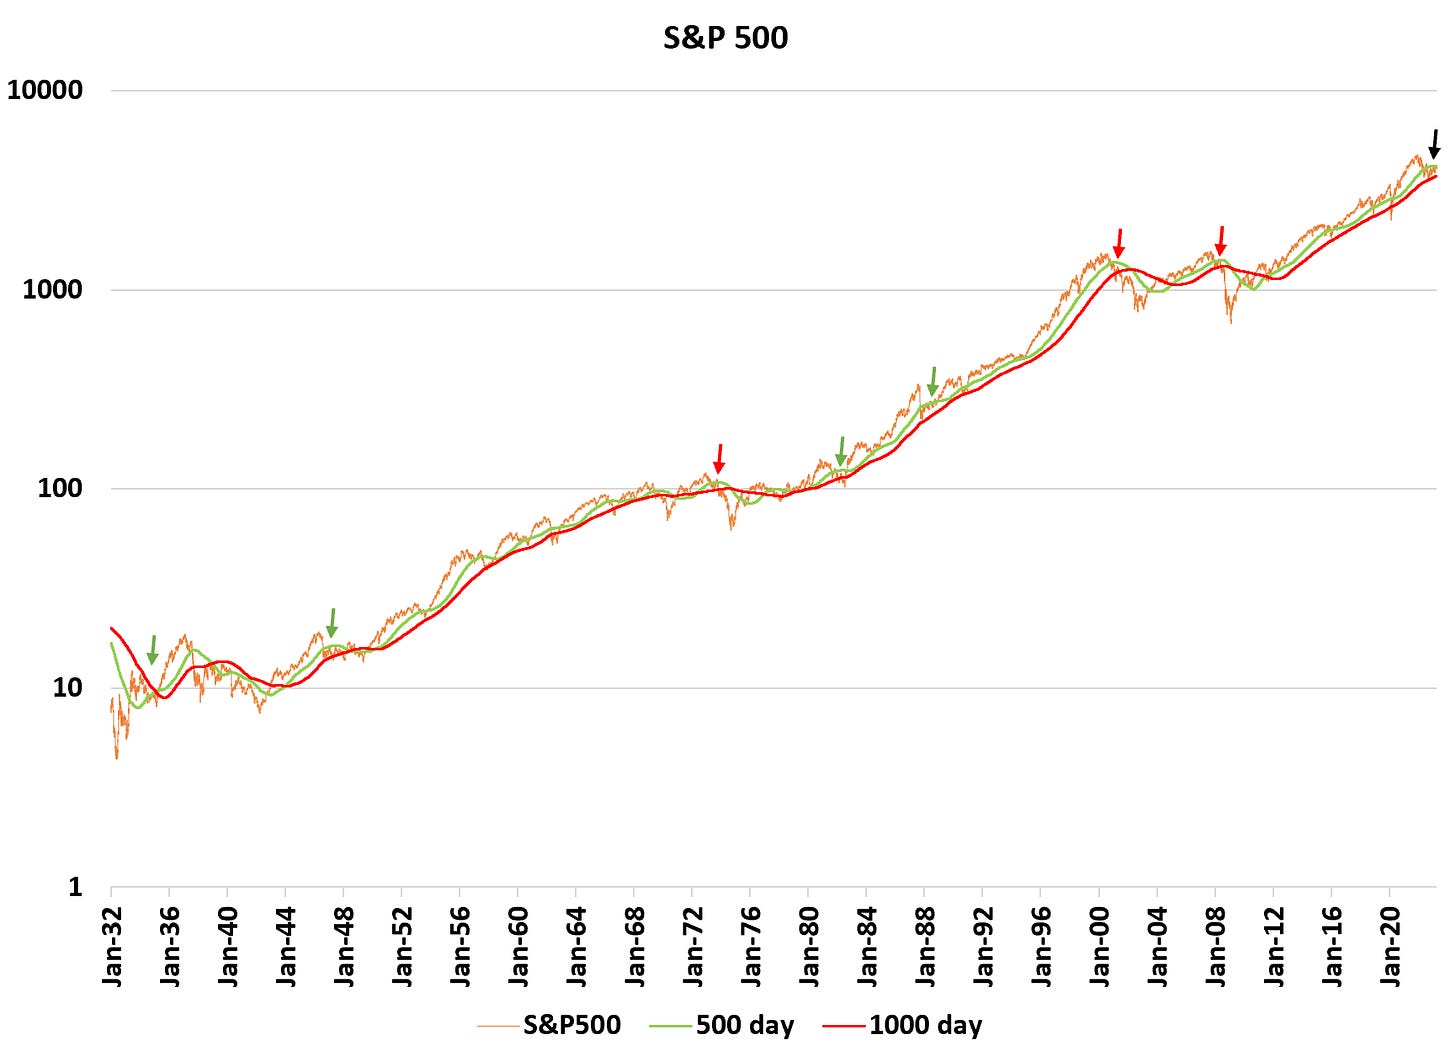
These levels currently sit at 3,732 and 4201 respectively… and with the S&P500 now at 4169, we are only a percent or so from breaking higher (as we did after the breaking of inflationary episodes in 1948 and 1982). Roughly half of these episodes resolved higher and half lower, so no predictive value here. But should we move higher, it’s unlikely to be a function of rising earnings — rather rising valuations will again take the fore as we’ve seen YTD in 2023. This suggests momentum, not value, will be the leading factor as passive inflows push us higher still… a car with no brakes still heading uphill. Whether we resolve higher or lower remains to be determined, but it’s likely our period of consolidation is coming to a close.
As always, comments appreciated.


Do you really think they'll throw Daly under the bus? she ticks so many of the woke boxes it would seem nearly impossible
Thanks. Appreciate your dive into these topics. Keep up the great work.