Giving Credit When Credit is Due
Models matter -- and the Fed is ignoring the obvious signals that policy is too restrictive already.
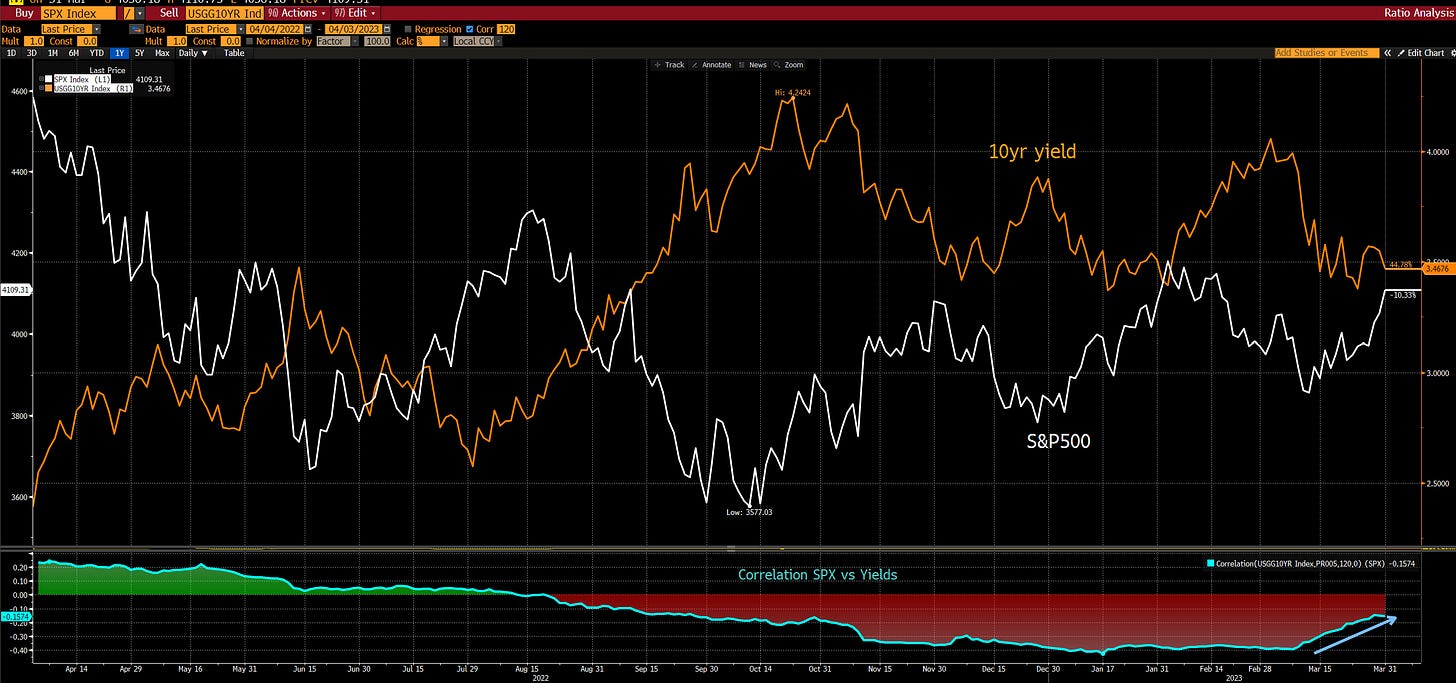
Once again, we’re going to temporarily veer away from a discussion of passive to consider the possibility that regulators and markets have lost the plot. With the recent bank run apparently behind us, equity markets have rallied sharply while rates markets have consolidated their recent move. The strongly negative correlation between interest rates and equities has characterized much of the last year and is beginning to weaken. Leadership has changed markedly, with Large Growth trouncing economically-sensitive Small Value.
The well-publicized retreat in the VIX has paralleled a decline in realized equity volatility and there remain few signs of the “broken VIX” with implied vol spread vs realized showing no meaningful signs of deviating from historical trend. Yes, we’re in a warning zone, but selling vol has remained the profitable trade:
Indicators of interest rate volatility remain the primary warning sign, with the MOVE index sitting at the 94%ile versus long history even after retreating sharply in the past week. If we look across asset classes, this is the key source of uncertainty.
Equity leadership has shifted (the new bias towards larger size and quality), suggesting that cyclical fears are beginning to matter even as equity markets rally. In fact, microcaps made a new bear market low in March, and the divergence between large and small is beginning to resemble the late 2021 dynamic, with large-cap indices pushing to new local highs while the small stocks make little progress.
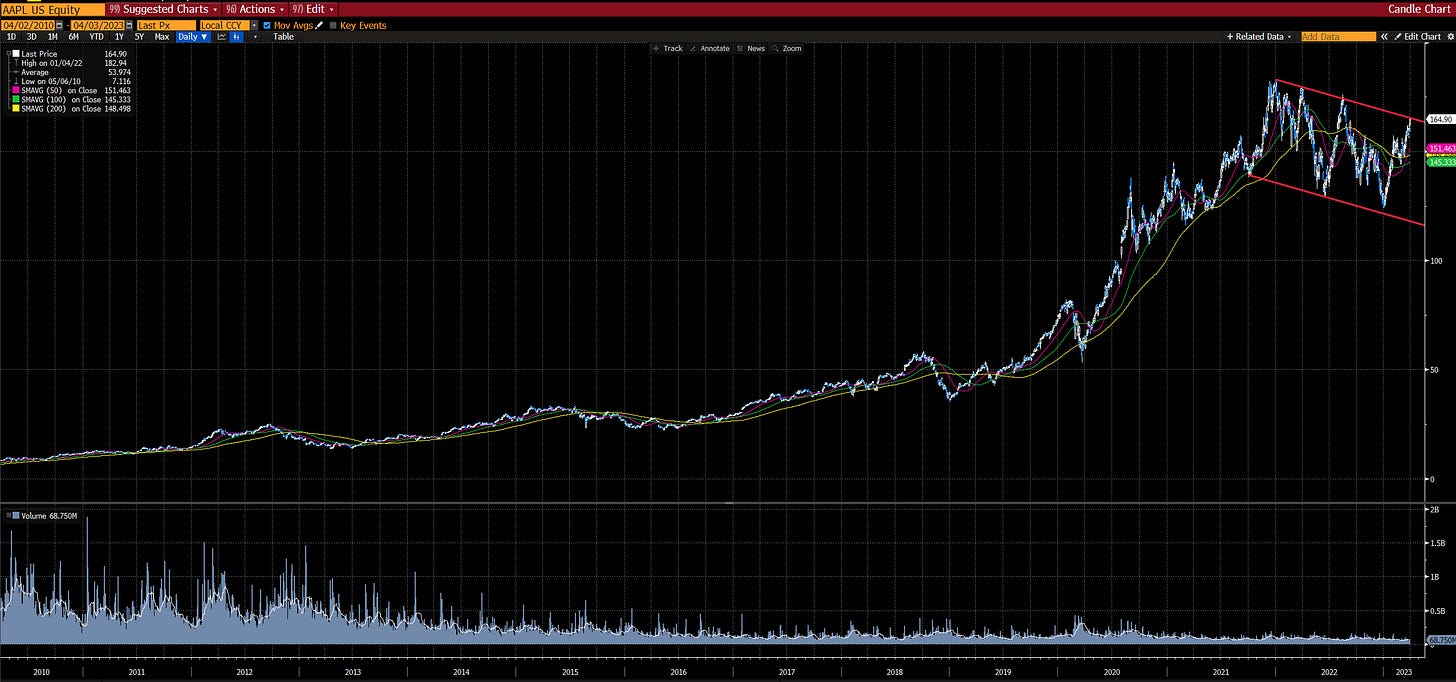
The frustration of bears is tangible, with Michael Burry the latest victim. His call for Apple to make new lows has certainly been thwarted (for now), as it is closer to all-time highs than lows. Bears have basically one line in the sand left:
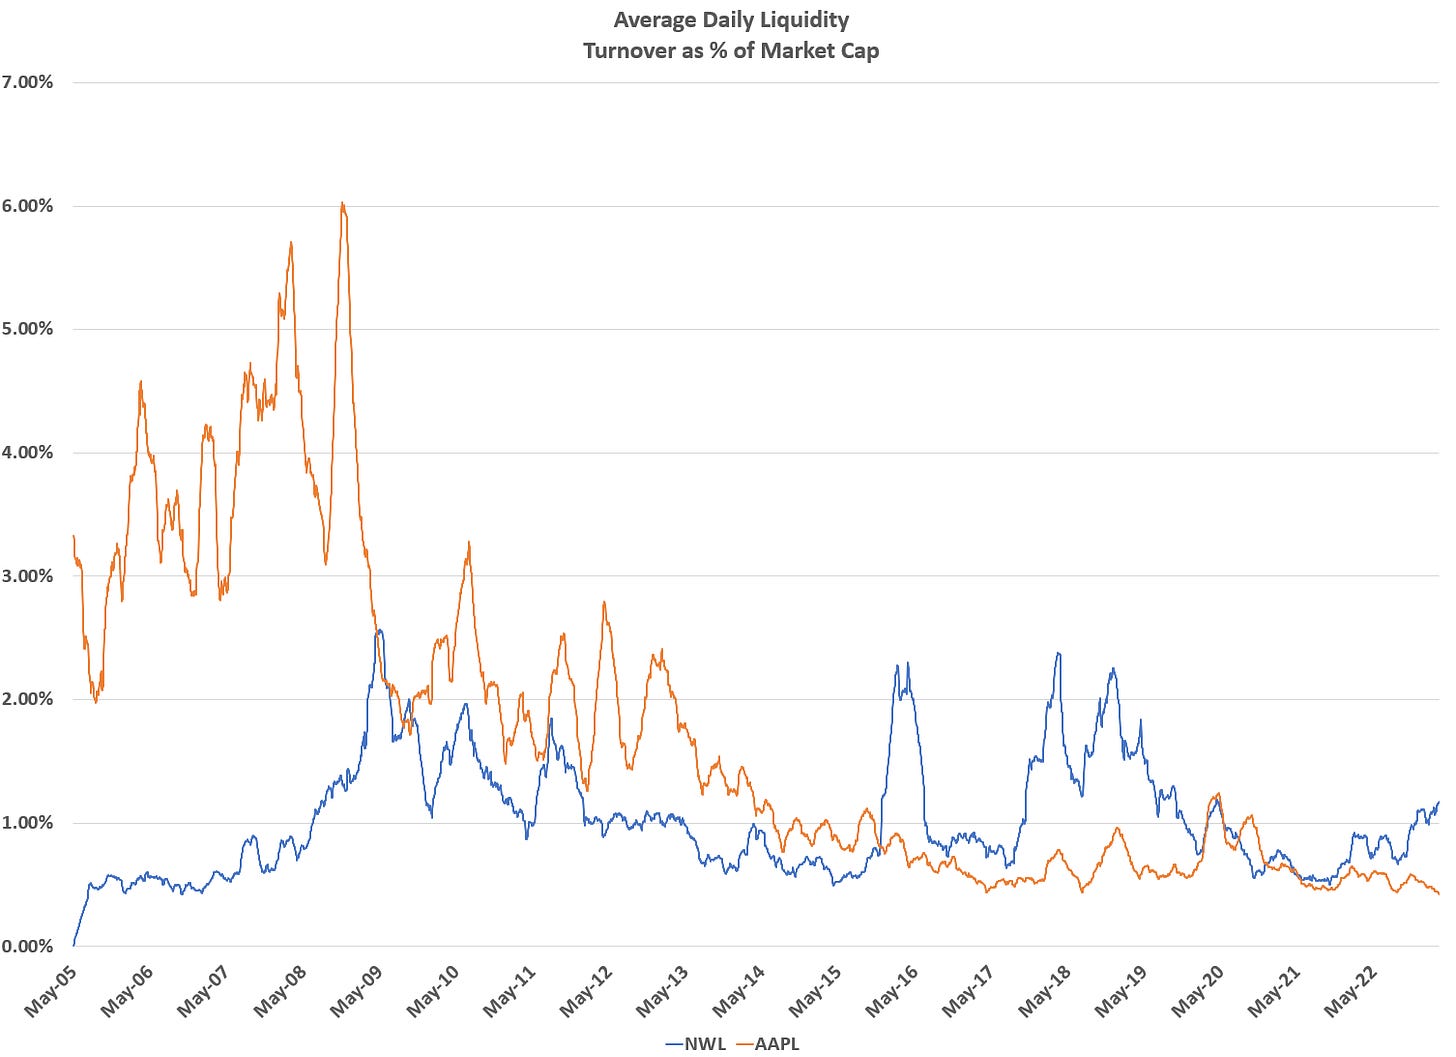
And here we have a quick passive insight… many assume that the impact of passive/index strategies has the largest impact on the small stocks in the index. This is increasingly untrue. Liquidity does not scale with market cap — in fact, it works somewhat in reverse as turnover as % of market cap falls with increases in market cap. Note the difference in liquidity between the largest stock in the S&P500 (AAPL) and one of the smallest stocks (Newell/NWL):
With Apple being the largest stock in the S&P500 and Apple's absolute volume and liquidity falling (see above charts), I wonder where the buying pressure might be coming from? Please note, these are very rough estimates. Add in futures, where underinvested hedge fund managers and CTAs would be chasing, and a planned record corporate share buyback, and the picture becomes pretty clear:
So we have evidence of a chase in equity markets. What about credit? Credit is showing signs of deterioration. Lower quality high yield, Caa and below, is seeing spreads versus Baa inline with the 2008 Bear Stearns takeover:
This is particularly concerning when we consider the relative tightness of the energy sector. As always, problems emerge in sectors considered “safe” before this cycle.
And yet, evidence of liquidity remains. I have to admit, I’m somewhat puzzled by competing headlines from January (pre-banking crisis) and March (admittedly pre-banking crisis):
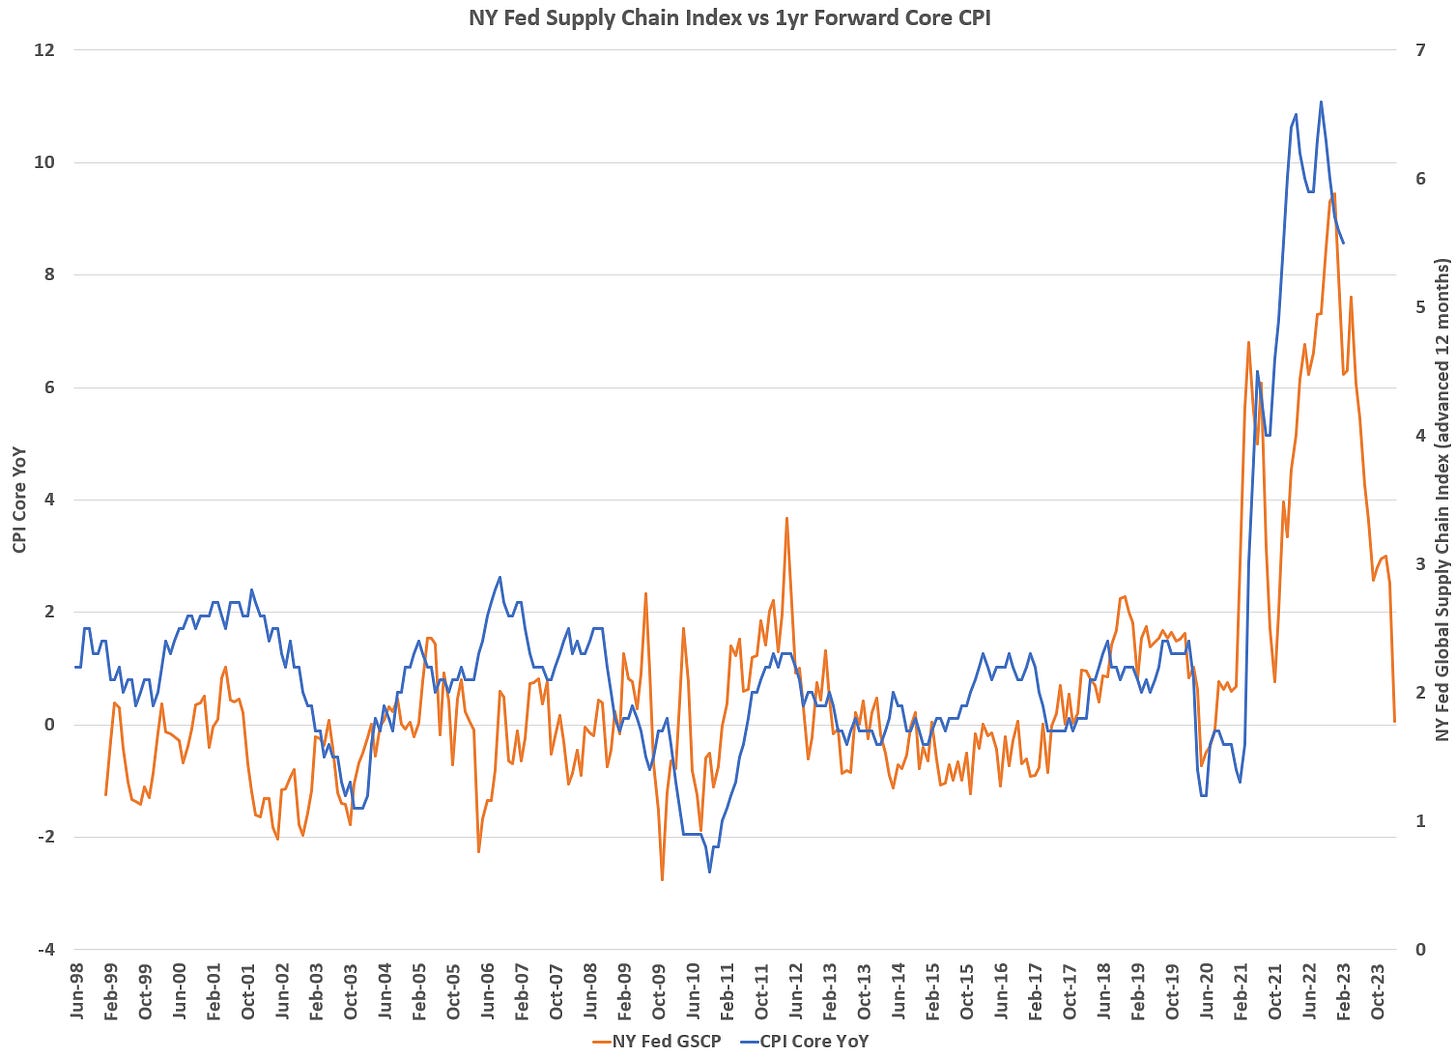
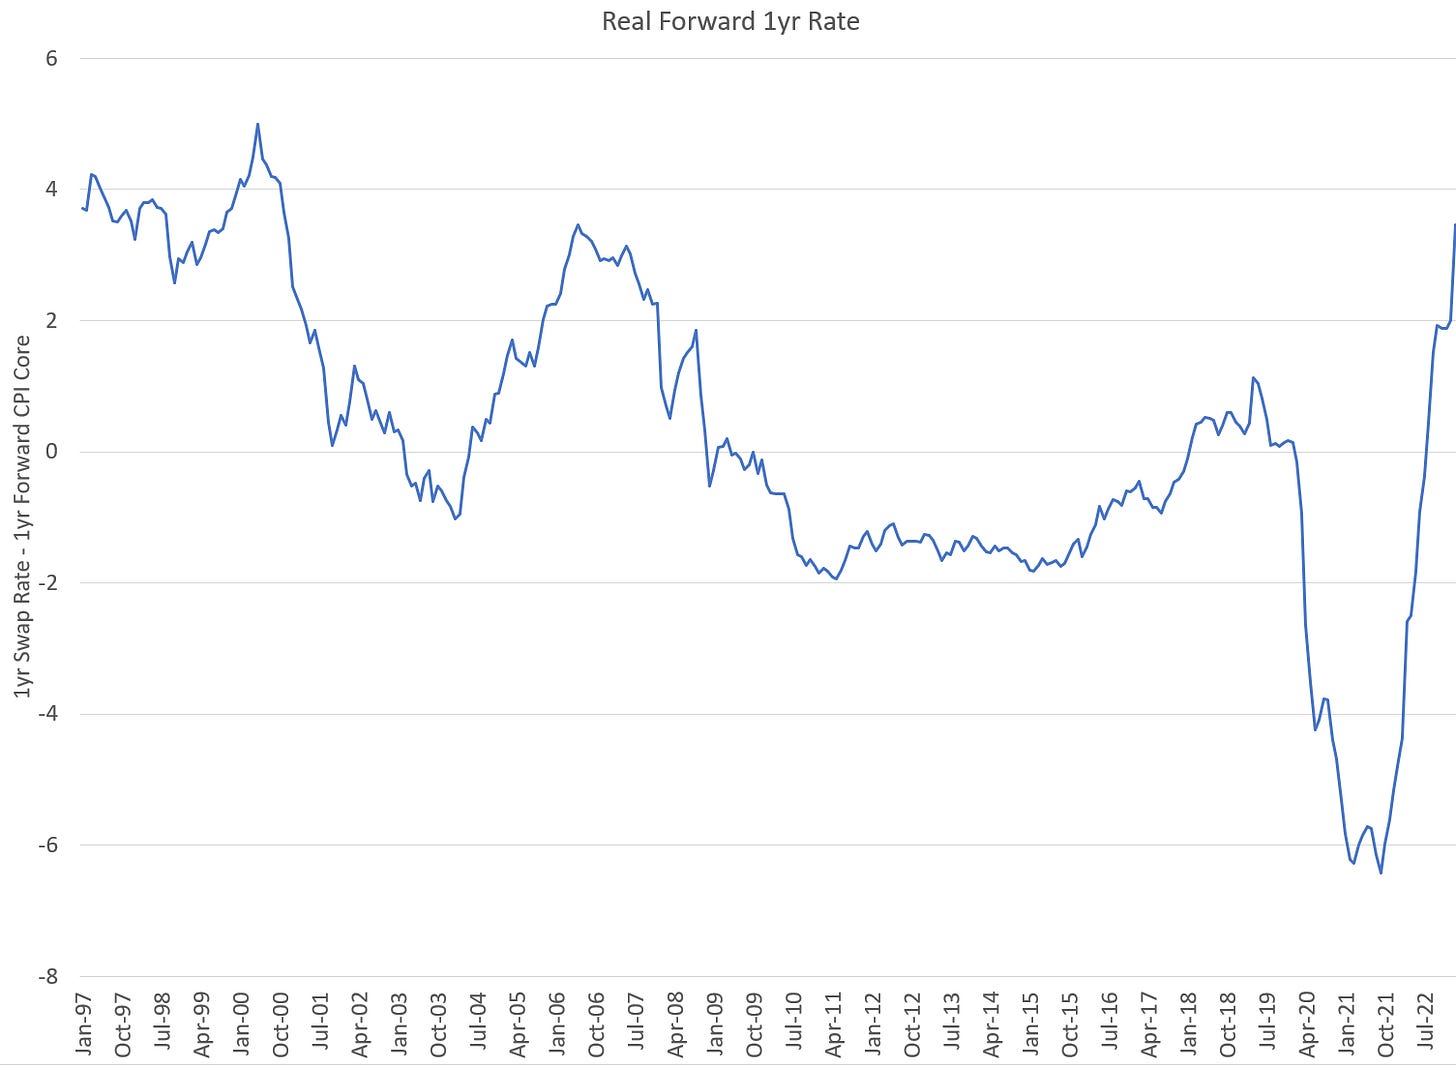
This is all a simple restatement of facts on the ground. The cries of “loosening financial conditions” are once again dominating as commentators focus on headline indices, especially the Nasdaq, compared to the internals of the market. Meanwhile, the NY Fed’s supply chain index suggests inflation is in the rear-view mirror. Using this metric as a forward-looking indicator of inflation (it explains about 50% of 1yr forward core inflation), we should expect that inflation will retreat below 2% over the coming year. Will this be realized? Unlikely given the well-publicized lagging nature of OER — but if it does, despite that caveat, we’ll be looking at serious deflation across all real-time indicators.
Using this metric, forward-looking real rates are as restrictive as they were at the start of the GFC’s subprime crisis:
CFOs have noticed this dynamic and a puzzling divergence has developed between their assessment of their own business and the broader economy. This is unprecedented, and I’d be lying if I suggested I know what it means. Regardless, the deterioration in both metrics suggests something wicked this way comes.
Likewise, data is beginning to emerge validating my concerns about data issues with traditional metrics. In this cycle, college graduates are seeing unemployment rates rise more rapidly than those with less than a college degree. The unemployment rate for college grads bottomed in Sep 2022 and has risen 0.2% while those with less than a college degree saw unemployment rates bottom in January. They have also now risen 20bps, but off of a rate nearly 2.5x higher (1.8% bottom for college grads, 4.3% bottom for less than college). Compared to the labor force prior to the GFC, college graduates now make up nearly 40% of the labor force versus only 28% pre-GFC.
The net impact of this change is to understate the actual unemployment rate and the rate of claims/beneficiaries. On a demographically adjusted basis, we’re sitting at the same level of unemployment that preceded the 2000 and Covid recessions. We’ve apparently found a floor:
This past week, the NY Fed released a blog post that hints at a growing awareness of these issues. They examined the “low labor force participation rate” that bulls have pinned their hopes on and found the evidence lacking. Why are you reading this now?
You are reading this now because they are acknowledging that growth is set to slow markedly. The recovery is over, and we’ve hiked too much. Like October 2007 and February 2020, the markets are responding to dynamics of inelasticity more than economic fundamentals. Watch the credit markets and small caps as the bid for safety kicks the mega-caps higher. They are telling the real story.
Comments appreciated as always.








Excellent as always. What are the variables that go into your estimated "Vanguard share of AAPL daily turnover"?
Would be really interested in thinking through the assumptions here.
Its a cabal of hubris and stupidity…Lets Define: stupidity is compatible with high educational achievement, and it is more the property of a political culture than of the individuals in it, needing to be tackled at that level.
So metrics that do not measure…Policy makers that refuse to adapt and do the right thing at all levels…Corporate America, FED, Congress, Senate, and the Presidency! Like how can you have this scale of bad executive decision making? Beliefs…pure dogma! I will say this…Have a “Reasoned View” 3MOs out….6MOs or more? It’s pure Astrology and nothing else!
Someone said it best this weekend, take out A.I and insert what you like….”Let me be blunt. Those who are afraid of AI feel deep down that they are impostors & have no edge. If you have a 1) clear mind, 2) a deep, not just cosmetic, understanding of your specialty, 3) and/or are original enough to reinvent yourself when needed, AI will be your friend. 2) Many in the responses invoked a "threat to society" by AI. That's a separate problem; but for now do not self-servingly invoke a "threat to society" when what's under threat is your little franchise and rent seeking.” —Taleb