What the Treasury Needs
An Open Letter to Mr. Secretary

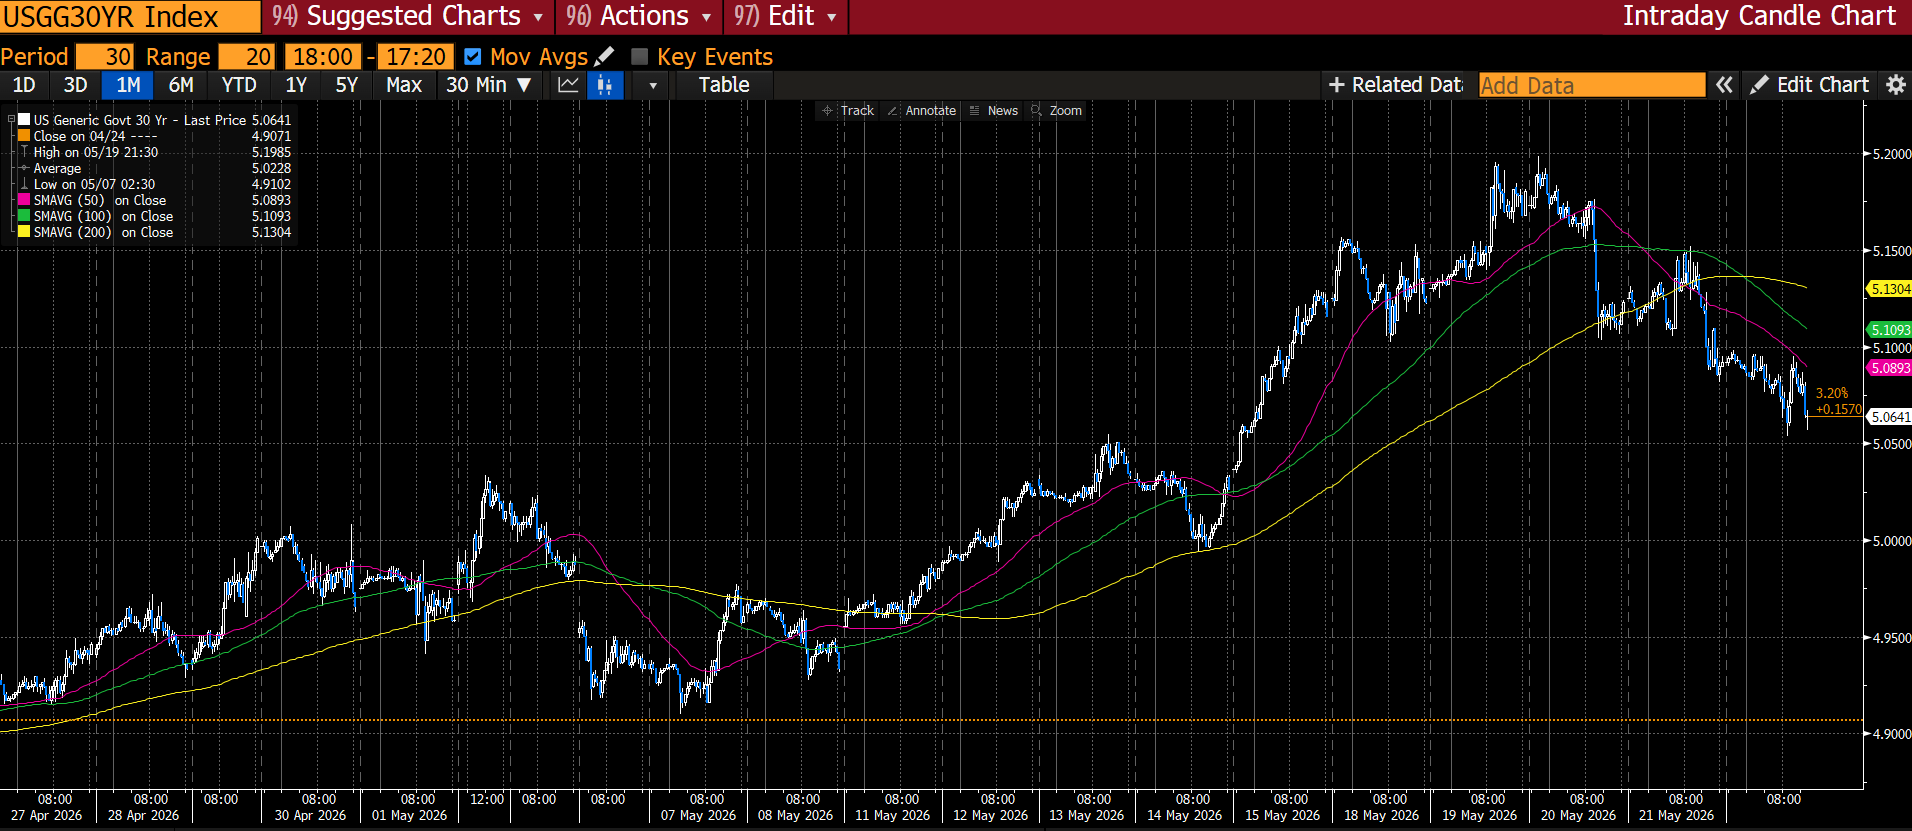
Last week we started to see the first signs of “panic” in the back end of US rates. The 5.15% I offered readers on Sunday became 5.20% by Wednesday:
There’s lots of nonsense chatter that “we need higher rates”:
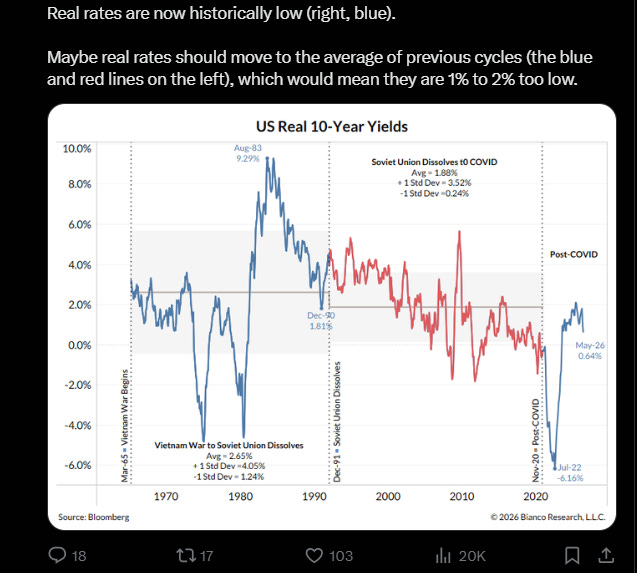
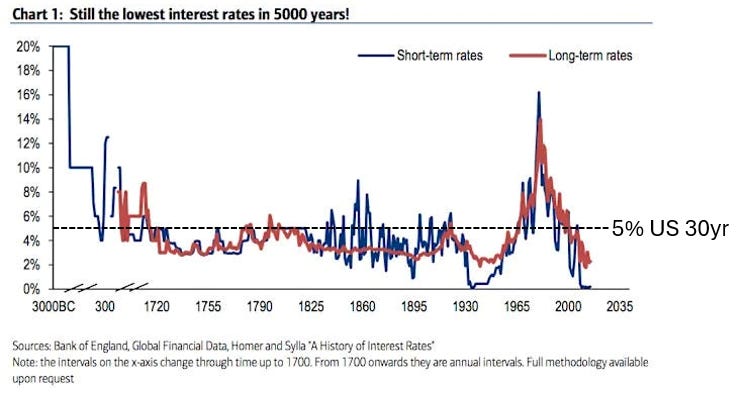
Readers of YIGAF should know by now that I will NEVER show a chart and say, “Maybe it should be the average of previous cycles.” Among other issues, define “previous cycles”? I would guess most of my readers have not thought to update this popular chart from a decade ago:
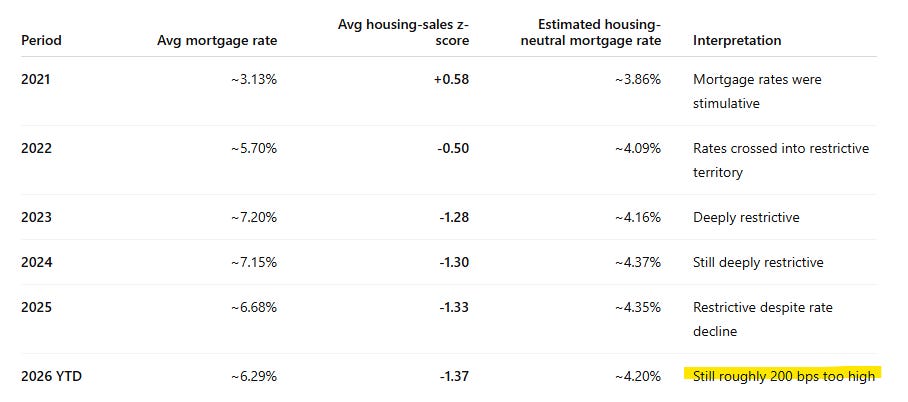
The evidence that rates are restrictive is painfully clear to anyone looking beyond the equity market into the real world of “financed products”:
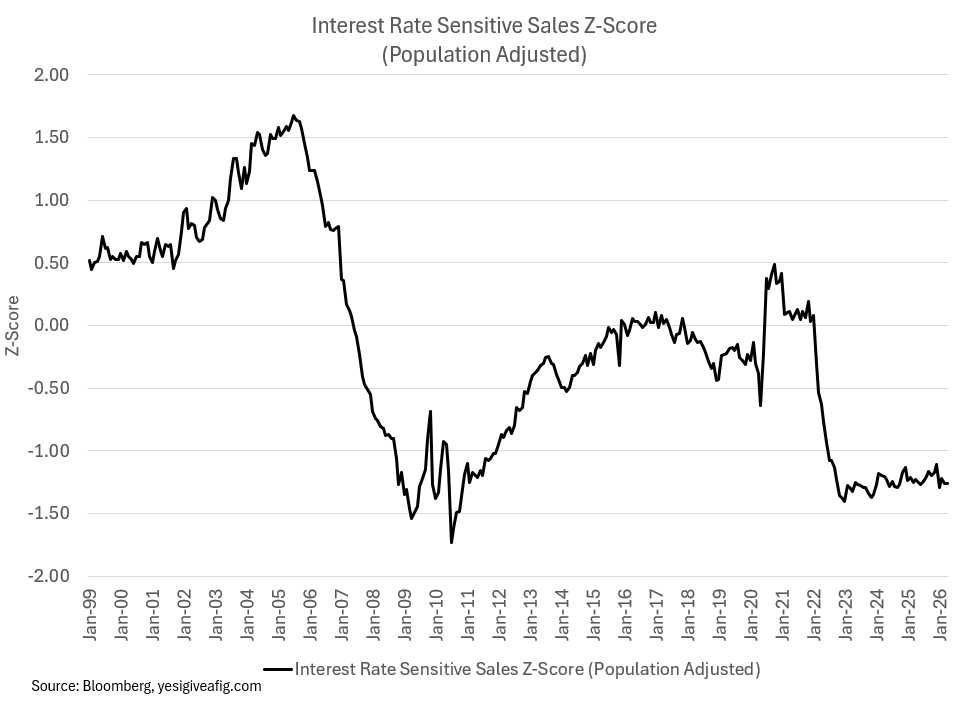
We can run an analysis on the “neutral” mortgage rate that would get population adjusted sales of housing “back to normal.” Suffice it to say, it’s much lower:
And yet, nobody seems to care. I was at an institutional investment conference on Tuesday, speaking to some of the largest institutional allocators. I pointed out the surge in rates we’ve experienced and asked the room, “How many of you have increased your allocation to sovereign debt?”
Not one hand went up of roughly 500 in attendance.
The same day, a headline from Bloomberg caught my eye — finally, people are beginning to notice this is not a “US story” and recognizing that “something deeper is in play”:
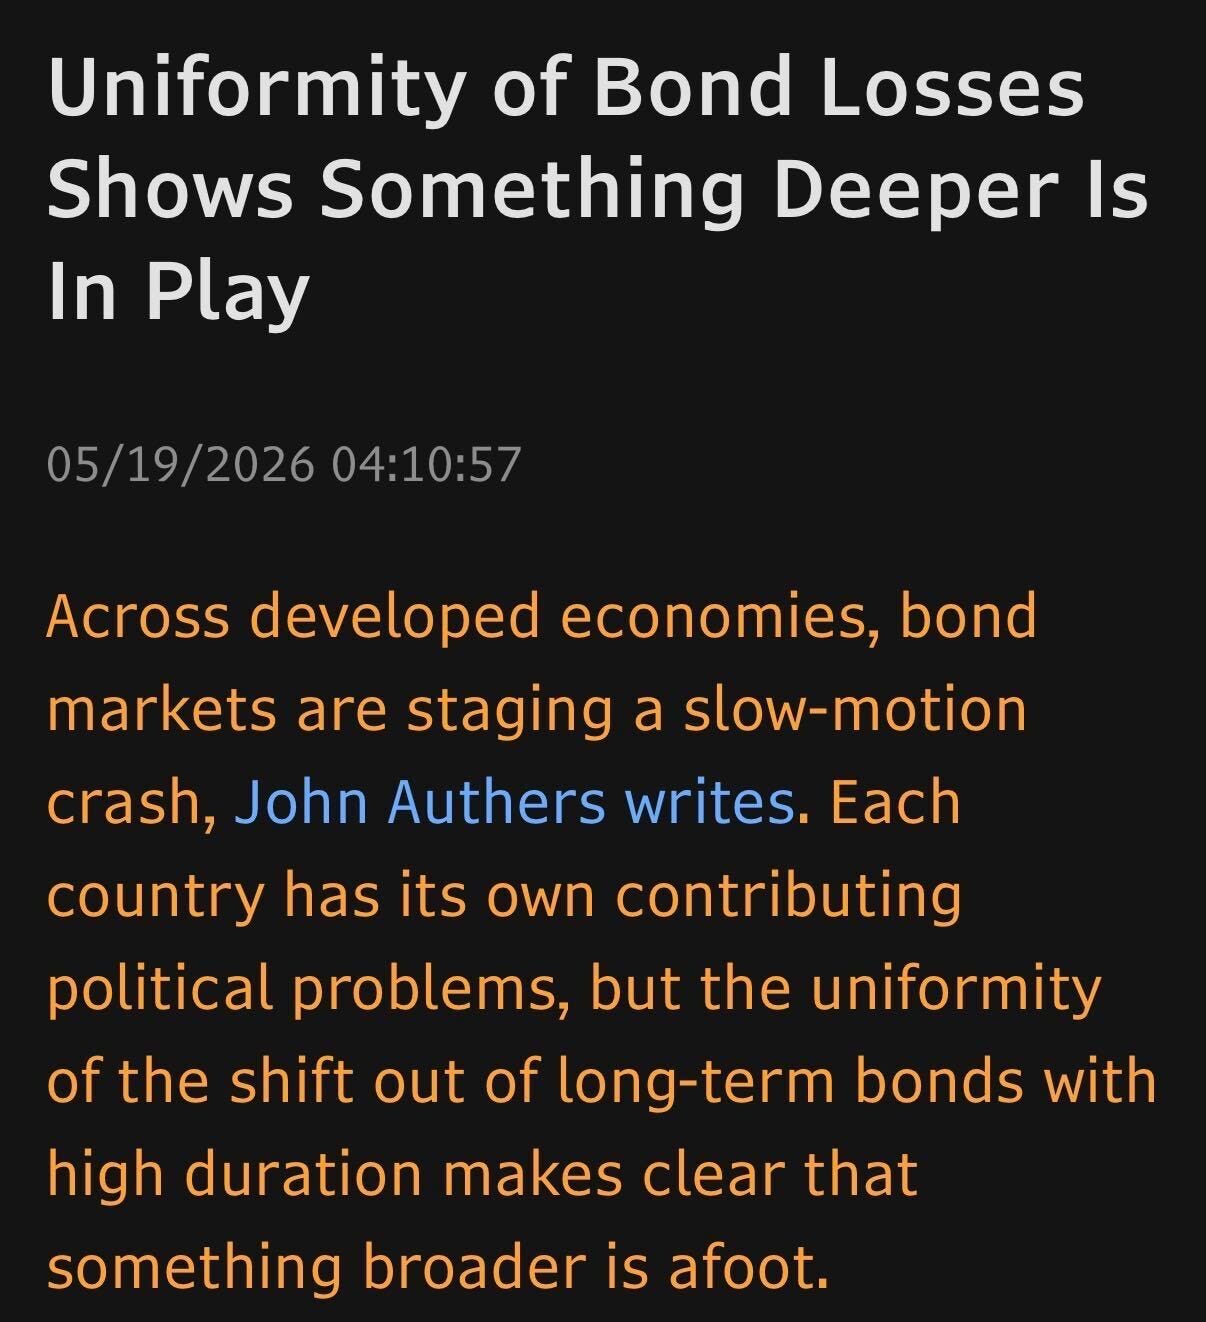
Now the article itself is the typical nonsense — “equities seem impervious” while “bonds hit levels not seen since 2000” and “we have too much debt.” Readers of YIGAF know how I feel about this:
“Maybe I don't want to spend my life sittin' around and explaining shit to people.” — Good Will Hunting
And then the Stones remind me of the simple truth:
You can't always get what you want
But if you try sometime, you'll find
You get what you need
So I felt compelled to dash off a message to our Treasury Secretary.
Attached is my open letter to the US Treasury Secretary explaining exactly what is happening to the US Treasury market and exactly what I think we should do about it — the Sovereign Debt Optimization Facility (SDOF). I have no idea if we’ll do this, but I think it’s about as coherent a plan with as few downsides as humanly possible. I have no idea why we WOULDN’T do this.
For those who want the “Explain it Like I’m a Golden Retriever” version:
The Problem: When interest rates were almost zero, the U.S. issued trillions in long-term bonds and mortgage bonds paying tiny interest (0–2.25%). Now rates are higher, those old bonds are worth only about 55–75 cents on the dollar. Big banks hold roughly $1 trillion of them and can’t sell these positions without triggering huge losses that would freeze their ability to lend money. As a result, capital is “frozen” in the banking system.
Why It’s Dangerous: Giant “passive” bond index funds automatically make things worse. When bond prices fall, they buy less of the long bonds exactly when the market needs buyers — creating scary feedback loops that can spike rates and crash markets (like the U.K. in 2022, but much bigger).
The SDOF: Keep an emergency “swap program” on the shelf. When a real crisis hits (and we’re very close now), the Treasury would allow banks to voluntarily exchange their old, low-price bonds for new Treasury bonds at today’s fair market price. No new cash is printed — it’s an even swap of value for value. See the duration-weight math below.
How the Swap Works: A bank hands over $100 of old bond (now worth $65) and gets $65 of new bond. The bank’s balance sheet heals, and it can start lending again. The government pays a little more interest each year but owes $35 less principal later.
Big Benefits: Could lower long-term rates and mortgage rates by 0.4%–0.9%, helping homebuyers and the whole economy. It breaks the dangerous loop without bailing anyone out.
So without further ado, let’s SDOF our caps as the midshipmen did under rainy skies this week:

May 21, 2026
An Open Letter to the Secretary of the Treasury:
A Contingent Playbook for the Sovereign Debt Architecture
Michael W. Green, Chief Strategist, Simplify Asset Management | www.yesigiveafig.com
I. Executive Summary: The Structural Fault Lines
Mr. Secretary,
The modern financial architecture is increasingly defined by structural inelasticities that impair monetary transmission and threaten orderly price discovery. Three intersecting phenomena drive this friction: (1) a multi-trillion-dollar overhang of legacy low-coupon sovereign debt — and crucially, Agency MBS and Agency multifamily MBS/CMBS — trading at severe market discounts; (2) an acute asset-liability lock within the regulated commercial banking system; and (3) a hollowing-out of active market liquidity and fundamental price discovery. These stresses are fundamentally intensified by a massive, underappreciated structural blind spot in contemporary capital markets: the unyielding rise of passive indexing within fixed-income portfolios. While standard academic literature has treated passive aggregation largely as a phenomenon isolated to equity markets, its scale and mechanical structure inside debt portfolios create severe, non-discretionary volatility loops that directly fracture the sovereign transmission mechanism and the “information” available to a sovereign debt issuer.
During the near-zero-rate and zero-rate environment of 2010–2021, the United States Treasury and other sovereigns issued an unprecedented volume of long-duration obligations carrying coupons between 0% and 2.25%. In the aftermath of the Covid re-opening inflation shock, central banks globally raised policy rates rapidly. As real yields adjusted upward, the market value of these off-the-run vintage bonds collapsed, with many trading between 55 and 75 cents on the dollar.
Aggregate commercial bank unrealized securities losses (across both Held-to-Maturity and Available-for-Sale portfolios) stood at $306.1 billion at the end of 2025[1]. However, as of mid-May 2026, the current bond market selloff has accelerated aggressively, pushing the 10-year yield to 4.61%–4.67% and the 30-year yield to a cycle peak of 5.14%–5.18%[2], driving these accounting impairments back toward critical thresholds and severely widening off-the-run liquidity fragmentation.
Empirical data reveals the concentration of this paralysis: the three largest HTM holders — Bank of America ($497B), JPMorgan Chase ($334B), and Wells Fargo ($237B) — account for approximately $1.07 trillion, representing roughly 88% of the expanded target universe (inclusive of Agency MBS/CMBS)[3]. Their portfolios are uniformly dominated by Agency MBS with blended book yields of 1.66%–2.22%, generating an aggregate unrealized HTM loss of nearly $146 billion for these three institutions alone.
Under prevailing accounting standards (ASC 320)[4], commercial banks holding these instruments within Held-to-Maturity portfolios cannot liquidate to reallocate capital without triggering a “tainting” violation. Such a violation forces reclassification of the entire HTM book to Available-for-Sale, with mark-to-market impairments flowing through Accumulated Other Comprehensive Income; for Category I and II institutions (including each of the three named banks above), that flow-through reaches Common Equity Tier 1 capital directly[5]. Trillions of dollars of risk-bearing capacity therefore remain structurally frozen.
This memorandum establishes a comprehensive, contingent policy framework to defuse these vulnerabilities and reinvigorate the potential for private credit creation while directly reducing the term premium that has emerged: the Sovereign Debt Optimization Facility (SDOF).
The SDOF is not a peacetime debt management tool, nor is it proposed for prophylactic deployment. Pre-emptive intervention under normalized market conditions carries severe and asymmetric signaling, term-premium, and moral-hazard costs that compromise expected value. Instead, the SDOF is engineered as a “next-level” emergency playbook built upon the routine liquidity-support and cash-management buyback operations institutionalized by the Department since May 2024[6]. While the existing program provides critical operational precedent — scaling up to an anticipated $38 billion in off-the-run liquidity-support purchases and up to $75 billion in short-term cash-management buybacks per quarter by early 2026[7] — the SDOF represents an order-of-magnitude systemic escalation. It is maintained in operational readiness, to be deployed only upon defined quantitative trigger conditions, to absorb acute long-end dislocations before they propagate into broader portfolio-mechanics cascades.
Within a total marketable Treasury debt landscape of approximately $30.7 trillion[8], the targeted tranche is highly material for systemic liquidity without being structurally dominant.
II. Trigger Conditions and Quantitative Dashboard
Because of asymmetric reserve-currency and term-premium reflexivity risks, the SDOF is held in reserve as a rule-governed, contingent instrument. Under normalized market conditions, its deployment would damage Treasury issuance credibility. Under acute systemic dislocation, however, the asymmetric payoff inverts, and non-deployment becomes the higher-variance choice. The current market stress appears to be rapidly approaching these red-threshold conditions; the final determination as to whether the threshold breach qualifies rests with the Department.
1. The Liquidation Loop Trigger Scenario
The trigger scenario is a self-reinforcing long-end sell-off in which falling bond prices drive systematic and rebalancing flows, destabilizing the system. As fixed-income assets suffer mark-to-market drawdowns, multi-asset systematic strategies (Target Date Funds, 60/40, risk-parity, etc.) are mechanically forced to liquidate equities to rebalance bond sleeves. Concurrently, leveraged liability-driven investment (LDI) pools, basis traders, and pension margin programs hit thresholds requiring liquidation of their most liquid assets — including off-the-run Treasuries and Agency MBS — into the same market weakness.
The rebalancing flows designed to stabilize the system become destabilizing. Liquidity provision breaks down, and equity-bond correlations converge toward unity. The September 2022 United Kingdom gilts episode is the canonical recent template, scaled to the United States Treasury market[9].
2. The Fixed-Income Index Duration Engine: An Academic Blind Spot
Contemporary market macrostructure literature remains heavily equity-centric, exploring how passive vehicles skew stock valuations while leaving fixed-income dynamics entirely unaddressed[10]. This omission is critical: passive bond indices do not operate like equity indices. Because market-capitalization-weighted fixed-income portfolios price their components continuously, passive flows are mechanically forced to buy more duration when yields are low (and prices are high) and less duration when yields spike (and prices collapse).
This dynamic operates as the exact pro-cyclical mirror image of traditional Asset-Liability Management. In a strict ALM framework, raising policy rates collapses the present value of future liabilities while expanding cash income from floating-rate assets; the institution’s net structural deficit shrinks and its required investment duration falls. Conversely, the passive bond index has no liability duration to match — it reduces its long-duration buying simply because long bonds have become cheap and their market-cap weight has fallen.
Crucially, the current May 2026 bond market selloff is actively weakening the passive bid for duration. To illustrate the raw mathematical reality of this structural distortion under current conditions, consider a simplified two-bond index composed of a 2-year and a 30-year maturity bucket (assuming an index aggregate consisting of 10 bonds of $1,000 face value each, representing a nominal block value of $10,000 per maturity bucket) issued with identical initial 3% coupons:
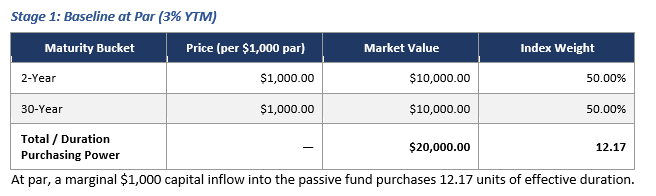
A 50/50 weight index with each $1 inflow buying ~12.17 units of effective duration. Now the Fed cuts rates:
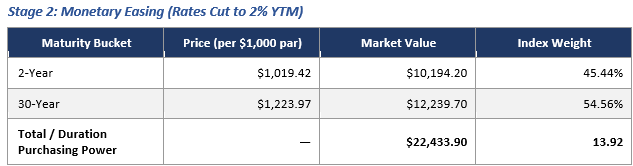
Due to price appreciation and the resultant 54.56% concentration in the 30-year slot, a marginal $1,000 capital inflow is now mechanically allocated to purchase 13.92 units of duration — a structural step-up in duration exposure at lower yields, i.e. momentum investing in bonds.
And now the Fed hikes rates aggressively:
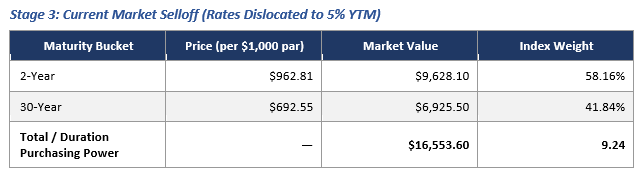
With the 30-year bond trading down to $692.55 per bond, its index weight collapses to 41.84%. A marginal $1,000 capital inflow now purchases only 9.24 units of duration — a 33.6% reduction in duration purchasing power relative to Stage 2.
Methodological note: Duration purchasing power is defined as the one-sided down-shock effective duration (D-eff) acquired by a marginal $1,000 inflow, weighted by market-value composition. Effective duration is computed as (P₋ − P₀) / (P₀ × Δy) for a 100 bp downward shock from each stage’s prevailing yield. Because positive convexity is asymmetric, this measure runs systematically higher than modified duration; it is the appropriate metric for capturing the asymmetric price response that drives the pro-cyclical loop. The 33.6% reduction in marginal duration absorption from Stage 2 to Stage 3 demonstrates that the index aggressively buys duration when it is expensive and systematically starves the sovereign long end of structural demand when it is cheap and dislocated.
By converting marginal inflows into minimal duration support precisely when a sell-off accelerates, the engine amplifies long-end yield spikes and forces the onset of systematic liquidation loops. Treasury’s recent strategy of starving the market of long duration by funding at the front end mitigates this in the short term, but leaves the underlying structural vacuum unresolved.
III. Facility Mechanics and Fiscal Optics
The SDOF operates on strict corporate-finance principles. Day-one risk parameters remain equalized across the system while cash-flow composition is restructured to repair institutional balance sheets and restore monetary transmission.
1. Voluntary Tender Exchange and Expanded Asset Inclusion
Rather than utilizing a coercive framework that invites soft-default concerns, the SDOF is structured as a voluntary tender exchange supported by a pre-cleared HTM accounting safe harbor.
The target universe formally accepts both Treasury obligations and Agency MBS/CMBS. Treasury does not issue Agency MBS; Fannie Mae and Freddie Mac securities are government-sponsored enterprise (GSE) obligations issued under federal conservatorship, supported by Treasury’s Senior Preferred Stock Purchase Agreements, and treated by markets as high-quality government-supported mortgage credit. Accepting these instruments in exchange for Treasury bonds of equivalent duration isolates the interest-rate risk without altering the sovereign credit profile. With the three largest banks holding nearly $1 trillion in Agency MBS at deep discounts, this expansion is necessary to truly unlock the HTM paralysis.
Under acute red-threshold stress, voluntary tender uptake is realistically estimated to range between 60% and 85% of the targeted institutional par universe. To overcome the collective-action problem — the prisoner’s dilemma in which banks wait for others to tender to reap the systemic benefits — the SDOF employs a First-Mover Incentive: early participants receive operational priority, settlement certainty, and a modestly more favorable exchange ratio (e.g., 66 cents rather than 65 cents on the dollar), marginally increasing Treasury’s cost but substantially guaranteeing coordination.
2. Blunt Assessment of Fiscal Optics
The transaction is settlement-cash-neutral: Treasury does not raise new net cash from the market at inception, but exchanges market value for market value. It is explicitly not cash-flow-neutral over time. The facility converts a portion of future principal obligations into current coupon expenses.
For ease of exposition, the macro calculations below use a full-universe engagement case: $650 billion legacy par exchanged at a blended market price of 65 cents on the dollar, establishing an aggregate market value of $422.5 billion. Treasury issues exactly $422.5 billion of new, on-the-run 30-year bonds at current market yields at par (100 cents).
On the illustrative assumptions of this framework (mirroring Bank of America’s 1.66% HTM book yield as the lower bound and 5.2% as the new-issue coupon), the math reflects the following profile:
• Legacy interest outlay: $650B par × 1.75% blended coupon ≈ $11.4 billion annually.
• Optimized interest outlay: $422.5B new par × 5.2% coupon ≈ $22.0 billion annually.
• Annual cash interest expense delta: +$10.6 billion.
• Headline principal reduction at maturity: $650B − $422.5B = $227.5 billion.
The public-finance case therefore rests entirely on systemic stabilization, monetary transmission, and liquidity restoration — not on deficit reduction. This is standard liability management: swapping long-term capital claims for immediate liquidity stabilization to prevent a systemic market failure that would cost the fiscal authority vastly more.
IV. Accounting and Legal Authority
The central implementation hurdle of the SDOF is the regulatory bridge across ASC 320. Surrendering legacy Agency MBS or Treasuries in exchange for new current-coupon Treasury bonds constitutes a sale under current GAAP, triggering tainting regardless of systemic purpose[11]. To enable bank participation without triggering systemic capital impairment, the SDOF requires pre-authorized, system-wide accounting treatment. Three pathways are ordered below by execution credibility.
Pathway 1 — Substance Over Form (Cleanest Margin)
The economic substance is a modification of terms on the same sovereign credit, not a market exit. FASB codifies a principle through which an exchange that is (a) issued by the same sovereign obligor or conservatorship, (b) of equivalent credit quality, (c) executed under a government-directed financial stability program, and (d) immediately re-classified as HTM does not constitute a sale for ASC 320 purposes. This pathway requires FASB to issue an interpretive update through its standard process.
Pathway 2 — Federal Banking Agency Interagency Capital Guidance
Separately and in parallel, the federal banking agencies (FRB, OCC, FDIC) can issue interagency guidance on regulatory capital treatment that effectively neutralizes the GAAP consequence for capital adequacy purposes — without changing the underlying accounting. This is the more realistic near-term route, as it is squarely within existing supervisory authority and does not require FASB action.
Pathway 3 — New Sovereign Exchange Safe Harbor
FASB adds a seventh safe harbor to ASC 320-10-25 specifically for government-directed sovereign instrument exchanges, tightly circumscribed with mandatory re-classification. This is the most durable solution but the slowest to implement.
The AOCI Carry-Forward and Forbearance Mechanics
The facility must be described honestly: it is not loss forgiveness, but a pre-authorized, system-wide loss-recognition bridge. To satisfy FASB’s investor-protection mandate, the accounting treatment mirrors existing AFS-to-HTM transfer mechanics under ASC 320-10-35-10(d). The unrealized loss on the surrendered security is carried forward in AOCI (MWG note for readers— Accumulated Other Comprehensive Income — a line on the equity section of a bank's balance sheet that captures certain unrealized gains and losses that bypass the income statement) and amortized straight-line through earnings over the remaining life of the new instrument.
For a standard institution tendering a $100 million legacy par block, the balance sheet transitions under the preferred safe harbor as follows:
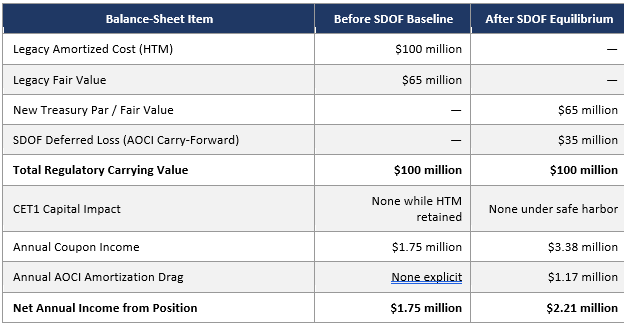
The $35 million unrecognized loss does not disappear from the ledger. It is reclassified into the AOCI carry-forward account and amortized straight-line through earnings over the 30-year life of the new security ($35M ÷ 30 ≈ $1.17M per year). Gross coupon income expands from $1.75M to $3.38M; deferred-loss amortization of ~$1.17M reduces net income to approximately $2.21M, resulting in a true incremental uplift of roughly $460,000 per $100 million of legacy par block relative to the prior baseline. Required AOCI disclosures ensure the economic substance of the permanent reduction in principal recovery remains fully visible to market participants.
V. Multi-Asset Transmission Channels
1. Convexity Squeeze and Curve Compression
Because the exchange converts $100 of old par into $65 of new par, the relevant duration comparison must be evaluated on an original-par-equivalent basis. The aggregate DV01 risk is permanently extracted from the market scales according to institutional participation thresholds. Drawing on historical Federal Reserve Operation Twist precedents and the foundational banking-intermediary transmission literature[12], the resulting compression in long-end term premium falls within a range of 15 to 50 basis points on the 10-year benchmark under upper-bound participation.
Insurance companies and pension funds are excluded from the primary target parameters, but for different reasons than banks. U.S. life insurance companies report primarily under NAIC statutory accounting, which carries most fixed-income holdings at amortized cost — functionally analogous to HTM and therefore not subject to the same market-value capital pressure. Defined-benefit pension funds, meanwhile, have liability-duration matching requirements that make them likely to actively resist an exchange that shortens portfolio duration. Calibrating their specific ALM resistance levels is material to confirming the 15–50 bp compression estimate.
2. Mortgage Market Transmission
The retail mortgage market provides the primary consumer-facing transmission channel. As of mid-May 2026, Freddie Mac’s official PMMS showed the 30-year fixed rate at 6.36% as of May 14[13], while higher-frequency market surveys placed top-tier 30-year fixed rates closer to 6.49%–6.68% by May 18[14], tracking multi-month highs alongside structural long-end volatility. The SDOF impacts mortgage rates through two channels: the Duration Channel (15–50 bps via long-end term-premium compression) and the Capital Channel (25–40 bps via bank balance-sheet relief that compresses primary-secondary MBS spreads).
VI. Risk Controls and Boundary Setting
1. Federal Reserve Coordination
The SDOF operates directly in the Treasury market. A $422 billion duration extraction is functionally equivalent to an Operation Twist in its market effect. If the Federal Reserve simultaneously sells long-end Treasuries (Quantitative Tightening) while Treasury is attempting to swap them, the uncoordinated QT could nullify the term-premium compression entirely. A formal Fed-Treasury coordination annex, analogous to the 2020 emergency facility framework, is a prerequisite for deployment.
2. Sovereign Signaling and Foreign Holders
Foreign holders collectively own approximately $8–9 trillion in U.S. Treasuries, of which the foreign-official segment (central banks and sovereign wealth funds) accounts for roughly half. A sovereign-directed structural exchange, even if domestically targeted, could be interpreted as evidence that the United States is willing to manage obligations through structural modification rather than full market redemption. The penalty is mitigated by a dedicated foreign-holder communication strategy explicitly defending why the SDOF does not constitute a soft restructuring — voluntary tender, fair-value-neutral pricing, and preserved contractual integrity for non-participants — thereby protecting the reserve-currency premium.
3. Rate-Path Dependency
Present-value neutrality is structurally true at current discount rates, but it is rate-path dependent. A 100 basis point increase in long-end yields following SDOF deployment would immediately create a new cohort of discounted 30-year Treasuries. Constant sensitivity analysis stress-testing the NPV neutrality across renewed rate-rise environments must be maintained.
VII. Post-Deployment Distributional Audit
To maintain transparency and defend the facility against the narrative of an unearned institutional subsidy, Treasury should implement an objective post-deployment audit framework. The audit will track the functional integrity of baseline deposit-competition rails to ensure the expanded coupon income is shared between institutional capital rebuild and depositor return.
Where these rails are operational, they act as the primary line of defense to narrow the deposit gap. Where the diagnostic data identifies a persistent, structural failure of these competitive rails — or institutional hoarding of the SDOF coupon expansion — Treasury will utilize a graduated escalation path, moving from targeted public disclosures to the operational activation of the competitive backstop detailed in Appendix B.
VIII. Objections and Responses
Objection 1: This facility represents a taxpayer-funded bailout for banks that mismanaged duration risk.
Response: The SDOF does not provide financial extraction above market pricing. Banks tender assets at a deep, market-validated discount (e.g., 65 cents on the dollar) and receive new par paper matching that exact market value one-for-one. The transaction is fair-value neutral at inception; no losses are erased, and long-term terminal principal claims are permanently reduced. The required AOCI disclosures ensure the economic substance of the permanent reduction in principal recovery remains fully visible. The subsidy that does exist is the regulatory accommodation itself — the safe harbor against tainting — which should be named directly rather than denied. Its justification is systemic, not institutional.
Objection 2: Treasury is increasing near-term cash interest expenses during a period of fiscal deficit strain.
Response: The near-term cash-coupon service expansion (+$10.6 billion annually in the illustrative baseline) is counterbalanced by a structural reduction of $227.5 billion in terminal principal obligations. The arrangement represents standard liability management: swapping long-term capital claims for immediate liquidity stabilization to prevent a systemic market failure that would cost the fiscal authority vastly more in lost tax base, emergency facility deployment, and reserve-currency erosion.
Objection 3: Why not allow market discipline to work by letting under-capitalized or duration-trapped institutions fail?
Response: Allowing systemic liquidation loops to fracture the sovereign transmission architecture in the name of ex-post discipline creates extreme, uncompensated systemic variance. The underlying assets are United States sovereign obligations and Agency MBS — not impaired private credit ledger items. The balance-sheet freeze is an artifact of regulatory accounting rules (ASC 320) interacting with an unprecedented macro duration shock, not a default-risk insolvency.
IX. Concluding Disposition
By maintaining the Sovereign Debt Optimization Facility as a contingent, defined-trigger instrument, the Treasury preserves its policy capital, inoculates the institution against political and moral-hazard critiques, and remains fully prepared to stabilize the global financial architecture at the moment market-structure fragility breaks.
The facility’s success is not measured by maximum benefit to any single class of participant. It is measured by the restoration of orderly monetary transmission, the equitable distribution of benefits between institutional capital rebuild and broad public welfare, and the preservation of confidence in United States sovereign issuance.
The playbook is nearly complete. The accounting bridge is the remaining critical item. To compress activation from days to hours, the legal parameters must be pre-authorized. Once the liquidation loop begins, design time will have expired.
Appendix A — Illustrative DV01 Mathematics
The target universe comprises specific off-the-run Treasury obligations issued between Q2 2020 and Q4 2021 with maturities ranging from 2050 to 2051, plus eligible Agency MBS/CMBS vintages issued under near-zero-rate underwriting conditions. The mathematical extraction of DV01 is defined by the structural shift from deep-discount long bonds to par-value current-coupon obligations.
On a static-yield basis, duration compression reduces the portfolio’s sensitivity to parallel rate shifts and flattens the convexity profile, thereby reducing the systematic hedging requirements that primary dealers must absorb during a market rout. Per $100 million legacy par tendered: an old 1.75%-coupon, 25-year-remaining bond priced near $65 (book yield ~5%, effective duration ~19.3 years) carries a DV01 of approximately $125,700; the replacement $65 million of new 5.2% par 30-year bond (effective duration ~15.4 years) carries a DV01 of approximately $100,000. Net duration extraction per $100M old par is on the order of $25,700 per basis point, or approximately 20% of the original DV01 exposure. Scaled to $650 billion legacy par at 65% participation, the aggregate DV01 extraction is on the order of $108 million per basis point. (MWG Note: For readers interested in understanding this exposure more deeply, please refer to my great friend Harley Bassman’s latest note where he highlights the growing risk of the “Convexity Beast”)
Appendix B — Competitive Deposit Rails as a Post-Crisis Distributional Backstop
To ensure a credible deterrent against margin hoarding, Treasury should commence a parallel, long-term workstream to develop a digital sovereign savings platform utilizing the United States Postal Service network infrastructure.
To optimize execution efficiency and eliminate bureaucratic expansion, the frontend interface and backend clearing ledger are structured for competitive open bidding to private financial-technology and banking consortia. Standing up this deployment-ready infrastructure requires a parallel 18-to-36-month implementation timeline, encompassing procurement cycles, USPS operational integration, KYC/AML compliance buildouts, identity verification at scale, and FedNow rail integration. This framework requires navigating either targeted legislative authorization modeled on the historical Postal Savings System or an expansion of emergency statutory authorities under Treasury–Federal Reserve fiscal-agency mandates.
To insulate the regional and community banking sectors from destabilizing wholesale disintermediation, individual balances within this facility are strictly capped at the historical pre-2008 FDIC limit of $100,000. While accounts below this threshold constitute the numerical majority of domestic retail depositors, they represent a minority of aggregate system dollars. Quantitative modeling indicates full-scale activation would plausibly migrate 5% to 10% of the total domestic deposit base. This magnitude is precisely calibrated to establish an effective competitive price-setting mechanism for retail savings without impairing the baseline solvency or credit-extension capacity of the traditional banking ledger.
End Notes
[1]Federal Deposit Insurance Corporation, Quarterly Banking Profile, Fourth Quarter 2025 (Washington, D.C.: FDIC, February 2026). Total unrealized losses on held-to-maturity and available-for-sale securities portfolios declined $31.0 billion to $306.1 billion, the lowest level since Q1 2022.
[2]U.S. Department of the Treasury, Daily Treasury Par Yield Curve Rates, reporting cycle May 18–19, 2026. 10-year constant-maturity yield: 4.61% (May 18) / 4.67% (May 19); 30-year constant-maturity yield: 5.14% (May 18) / 5.18% (May 19), per Federal Reserve H.15 release.
[3]SEC EDGAR XBRL filings, 2024 Form 10-K and Q4 2024 earnings supplements for Bank of America Corporation, JPMorgan Chase & Co., and Wells Fargo & Company. HTM portfolio carrying values aggregated to disclosed securities footnotes.
[4]Financial Accounting Standards Board, Accounting Standards Codification Topic 320, Investments—Debt Securities, particularly ASC 320-10-25-9 through -14 governing classification and the consequences of sale or transfer out of the held-to-maturity category.
[5]FDIC Supervisory Appeals Review Committee Decision, 2024, addressing regulatory capital consequences of HTM portfolio reclassification under interagency capital rules (12 CFR Part 217 for the Federal Reserve; analogous provisions for OCC and FDIC). For Category I and II institutions, AOCI flows through regulatory capital; the AOCI opt-out remains available for Category III and IV institutions pending Basel III endgame finalization.
[6]U.S. Department of the Treasury, May 2024 Quarterly Refunding Statement, formally introducing regular liability-management and cash-management buyback operations.
[7]U.S. Department of the Treasury, February 2026 Quarterly Refunding Statement, detailing scheduled expansion to approximately $38 billion in off-the-run liquidity-support purchases and up to $75 billion in short-term cash-management buybacks per quarter.
[8]Federal Reserve Bank of New York, Treasury Market Data Baseline, Q1 2026; cross-referenced with SIFMA U.S. Treasury Securities Statistics (April 2026), reporting $30.7 trillion in outstanding marketable Treasury debt.
[9]Bank of England, Financial Stability Report, December 2022. Provides the structural review of LDI-driven liquidation cascades in the September 2022 UK gilts episode—the canonical recent template for sovereign-debt market dysfunction driven by leveraged-portfolio mechanics.
[10]Haddad, V., and Muir, T. (2025), “Market Macrostructure: Institutions and Asset Prices,” National Bureau of Economic Research Working Paper 33434. Documents the rise of passive investing above 40% of the equity market and articulates the structural blind spot in contemporary macro-finance regarding the analogous (and underappreciated) mechanics in fixed income.
[12]Haddad, V., and Sraer, D. (2020), “The Banking View of Bond Risk Premia,” The Journal of Finance, 75(5), 2465–2502. Establishes the empirical link between bank balance-sheet exposure to interest-rate risk and bond risk premia, providing the foundational banking-intermediary transmission framework for term-premium estimation.
[13]Freddie Mac, Primary Mortgage Market Survey, reporting cycle of May 14, 2026; 30-year fixed-rate mortgage benchmark at 6.36%.
[14]Mortgage News Daily and Bankrate higher-frequency survey indices, mid-May 2026; top-tier 30-year fixed rates at 6.49%–6.68% as of May 18, representing multi-month highs alongside structural long-end volatility.
