The Keynesian Stupidity Contest
Will no one think of the lenders?

Summary
Vanguard Flows and ETF Trends — while there are signs of changing flow patterns in ETFs, with technology sectors and single stocks receiving inflows traditionally seen in broad index funds, without mutual fund flow data conclusions are tentative. Data for February and March might not be available until possibly May.
Influence of Keynes and Market Behavior: I draw inspiration from Keynes, highlighting the nature of professional investment as a speculative activity based on predicting the consensus of average opinions rather than objective beauty or value. This perspective is used to reflect on recent market dynamics, including investment bubbles.
Broader Market Implications and Credit Risks for 2024: The SMCI/NVDA meme stock phenomenon extends beyond individual stock movements, particularly for the R2000. While eyes are focused on the S&P500 and NDX, they are missing the obvious credit refinancing risks in weaker companies and households.
A quick update on Vanguard flows…
I teased provocatively that there were indications that the flows may be turning… while evidence for a change in flow patterns is certainly evident in ETFs with technology and single stocks capturing flows that have traditionally headed for broad index funds, I cannot assure until mutual fund flow data is updated. And Vanguard is taking its own sweet time in filing. The SEC requirements are that fund flow data must be filed within 60 days of the end of the fiscal quarter. Theoretically, this means we could be waiting until May for February and March data, although I am hopeful it will come sooner:

In the meantime, we wait…
Institutional Subscriber Call
We are overdue for our institutional subscriber call and, candidly, I’ve been holding off because I was unhappy with my understanding of current market behavior. I think that has now been resolved and please expect an email to schedule the call sometime the week of March 25th.
The Main Event
A conversation I had with another hedge fund PM generated the title for this piece. While I am not a Keynesian (surprise!), the scribblings of the venerated & vilified madman continue to understandably influence my thinking as it relates to both economies and markets. This week, I found inspiration in Chapter 12 of the General Theory:
“…professional investment may be likened to those newspaper competitions in which the competitors have to pick out the six prettiest faces from a hundred photographs, the prize being awarded to the competitor whose choice most nearly corresponds to the average preferences of the competitors as a whole; so that each competitor has to pick, not those faces which he himself finds prettiest, but those which he thinks likeliest to catch the fancy of the other competitors, all of whom are looking at the problem from the same point of view. It is not a case of choosing those which, to the best of one’s judgment, are really the prettiest, nor even those which average opinion genuinely thinks the prettiest. We have reached the third degree where we devote our intelligences to anticipating what average opinion expects the average opinion to be.” — John Maynard Keynes, General Theory of Employment, Interest & Money (hereafter GTOEIM, pronounced, "get ‘im”)
"When I see a bubble forming I rush in to buy, adding fuel to the fire. That is not irrational." — George Soros
The past four years have had more than their fair share of bubbles for investors to chase. There was a short squeeze in Gamestop (from 150% short interest), another one in AMC (from 43% short interest), and another one in SuperMicro (from 12% short interest). Anyone notice a pattern? (declining short interest required for short squeeze). Below is the percent change in market cap for each of these bubble/meme stocks. GME experienced nearly a 10,000% increase in market cap (sorry, Mr. Plotkin), and AMC peaked at an 8,000% gain. SMCI is still marching higher with a 5400% gain so far. Perhaps the phenomenon is dissipating…

Nope… it’s growing. The same chart showing the absolute market cap is below. SMCI leaves the pretenders in the dust. SMCI started 2023 with $4B in market cap. It started 2024 with $16B in market cap. And as the Beatles sing… “Will you still need me, will you still feed me, when I’m $64B…” The answer, of course, is “yes” because the index inclusion trade that simultaneously puts SMCI into BOTH the S&P500 and the R2000 hits March 18th.
It’s certainly possible that the move in SMCI is over, but I guess we get one more bite at this apple into a final mania this week. Then, it gets interesting for the bears. In June, the R2000 has to eject SMCI. Around 7% of SMCI shares sit in various Blackrock and Vanguard small-cap ETFs. It looks like another 10% or so across various other small-cap fund complexes, although with delayed filing we can’t know exactly how many shares will be sold in June. Suffice it to say, “a lot.” This will be a fascinating test of the PBS (passive broadcasting system) and remember that the R2000 will be a much bigger loser from an SMCI retreat than the S&P500.

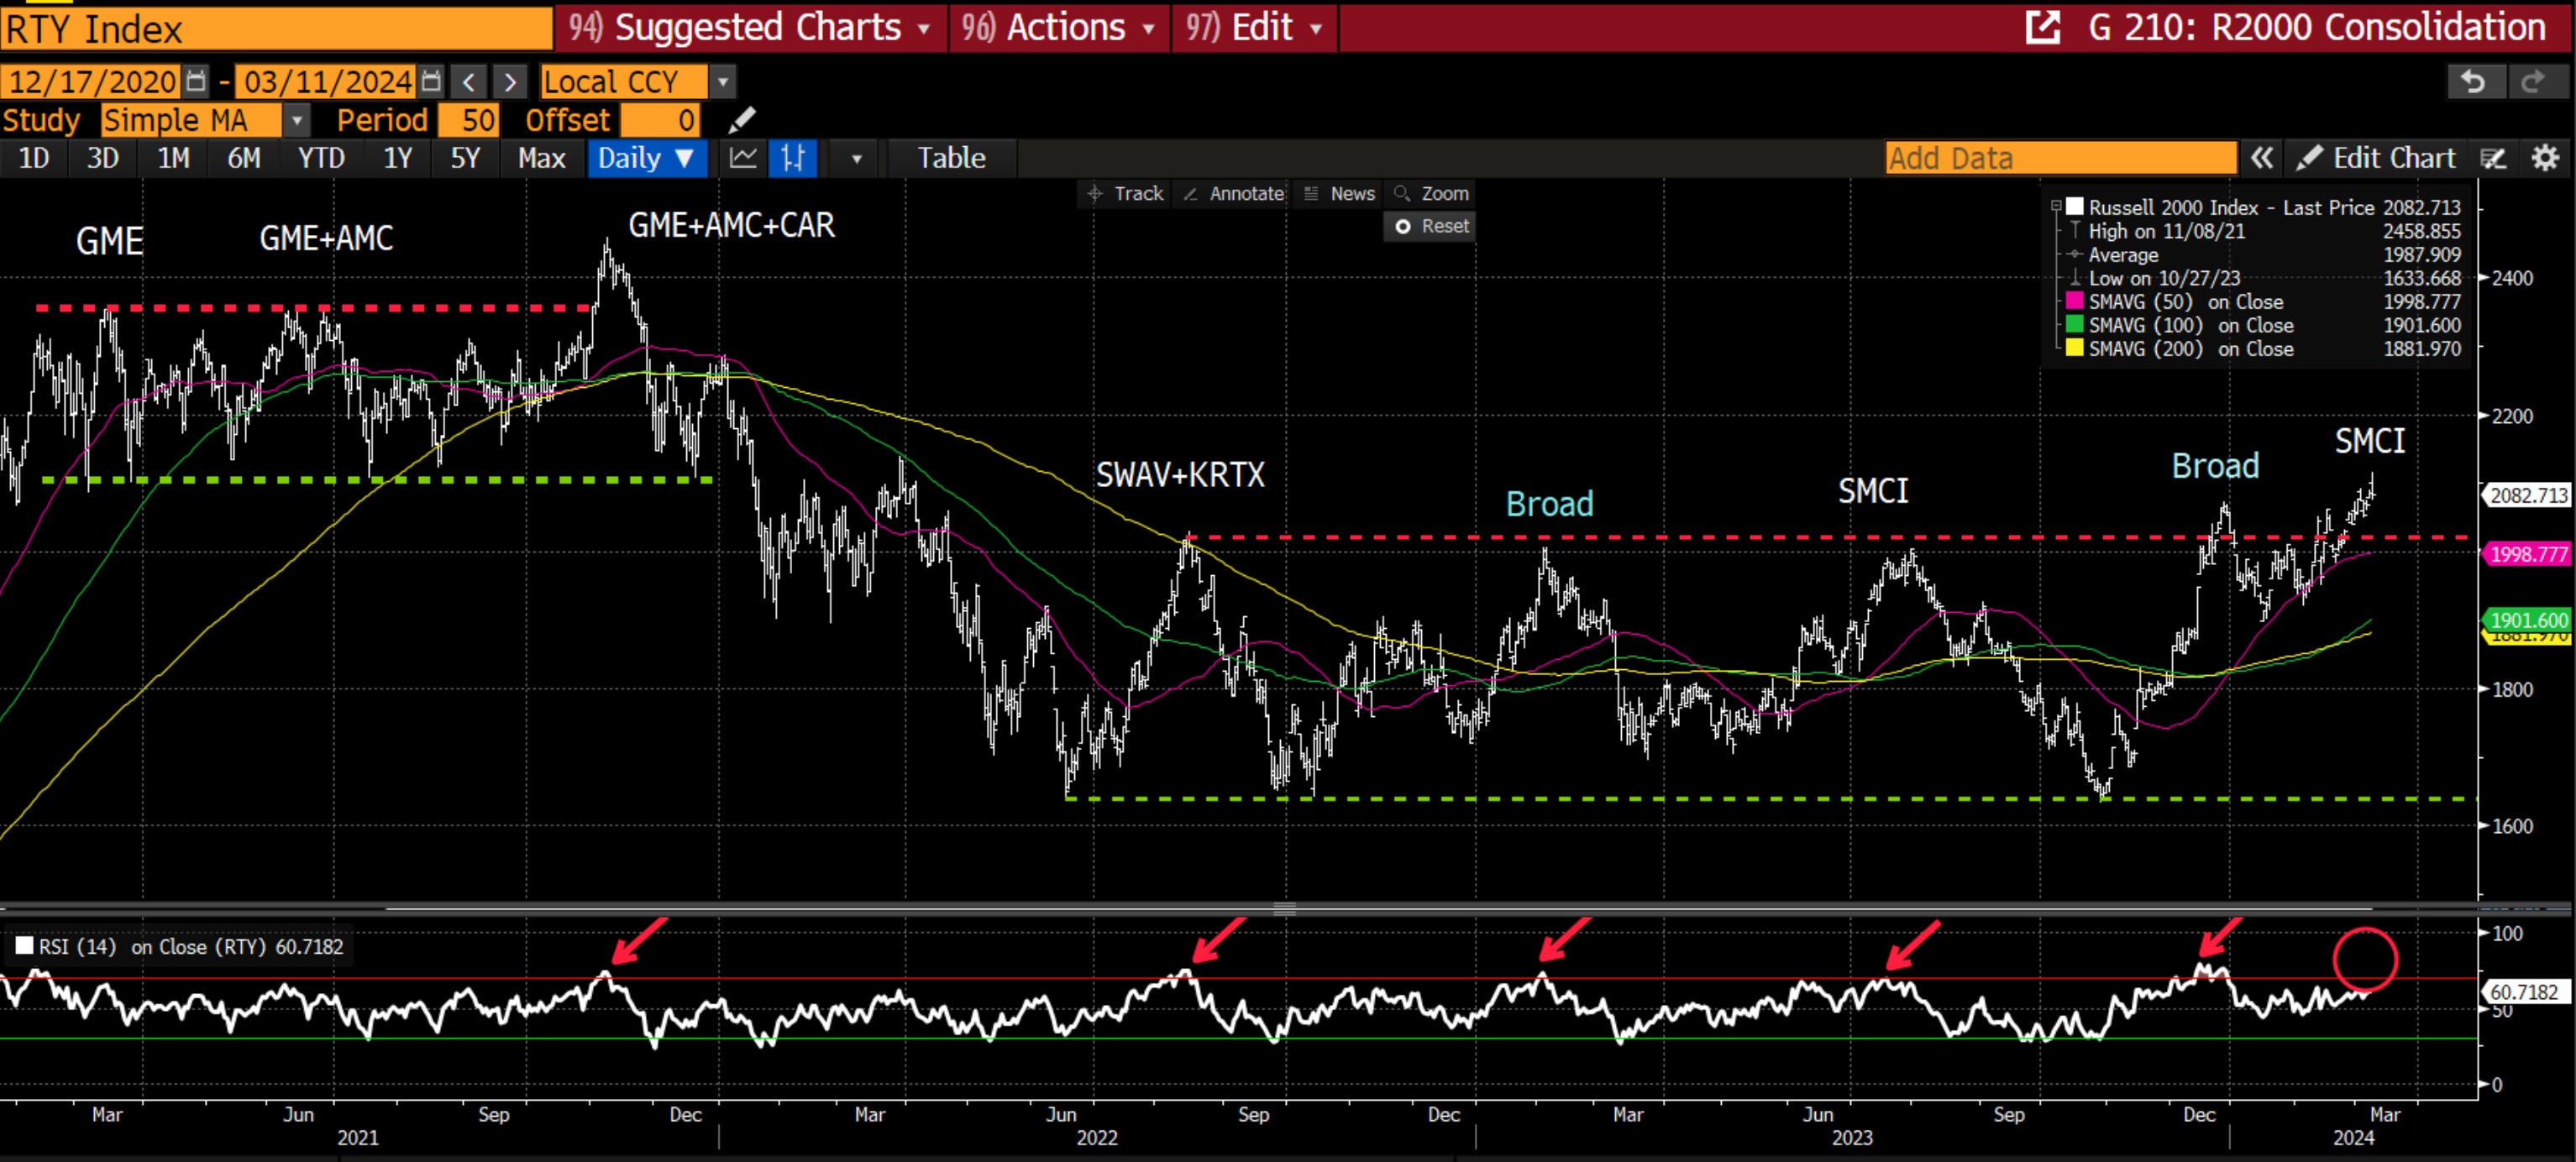
The behavior of these “mini” bubbles/memes has been significant at the index level. Throughout 2021-2024, the behavior of the R2000 has largely been governed by these meme stocks. In each peak since 2020 we’ve seen the distinct signature of at least one of these giant movers. In the latest move, SMCI alone accounted for 14% of the entire R2000 gain. This is almost 4x the impact that GME had in its torrid advance. I’d also note that my favored momentum metric, RSI (relative strength index), has failed to confirm this advance, setting up a divergence.
The advances in spring 2023 and Q4-2023 were broad enough that I wouldn’t lump them in the same category, but offering the same chart against the R2000 equal weight is instructive. For the median-based stock index, there has been no bull market or even a reversal —each high has been lower:

