Thanks for the Template, Vanguard
If you're encountering denial, beware of crocodiles.

Housekeeping notes
There are a number of Substacks that are worth highlighting to readers. These individuals have added to the richness of YIGAF, and I’ve been remiss in making note of their stimulative effect on my thoughts.
Not Your Advisor has written a nice summary of the recent Simplify ETF Conference at the NYSE. He first came to my attention for the work he was doing on podcast AI formats, but has gained my admiration for his dedication to learning:

Somebody (unclear if it is JP himself) is reposting all articles by/about JP Bouchaud, whose work I cannot recommend enough. A useful repository:

If you’d like to bend your mind a la Lewis Carroll, who famously delivered the defining benefit of believing the impossible:
“There’s no use trying,” said Alice; “one can’t believe impossible things.”
“I daresay you haven’t had much practice,” said the Queen. “When I was your age, I always did it for half-an-hour a day. Why, sometimes I’ve believed as many as six impossible things before breakfast”.
I strongly encourage you to check out, “Be Water” whose recent series on “hyper-prices” is worth a ponder:

Credit Market Update
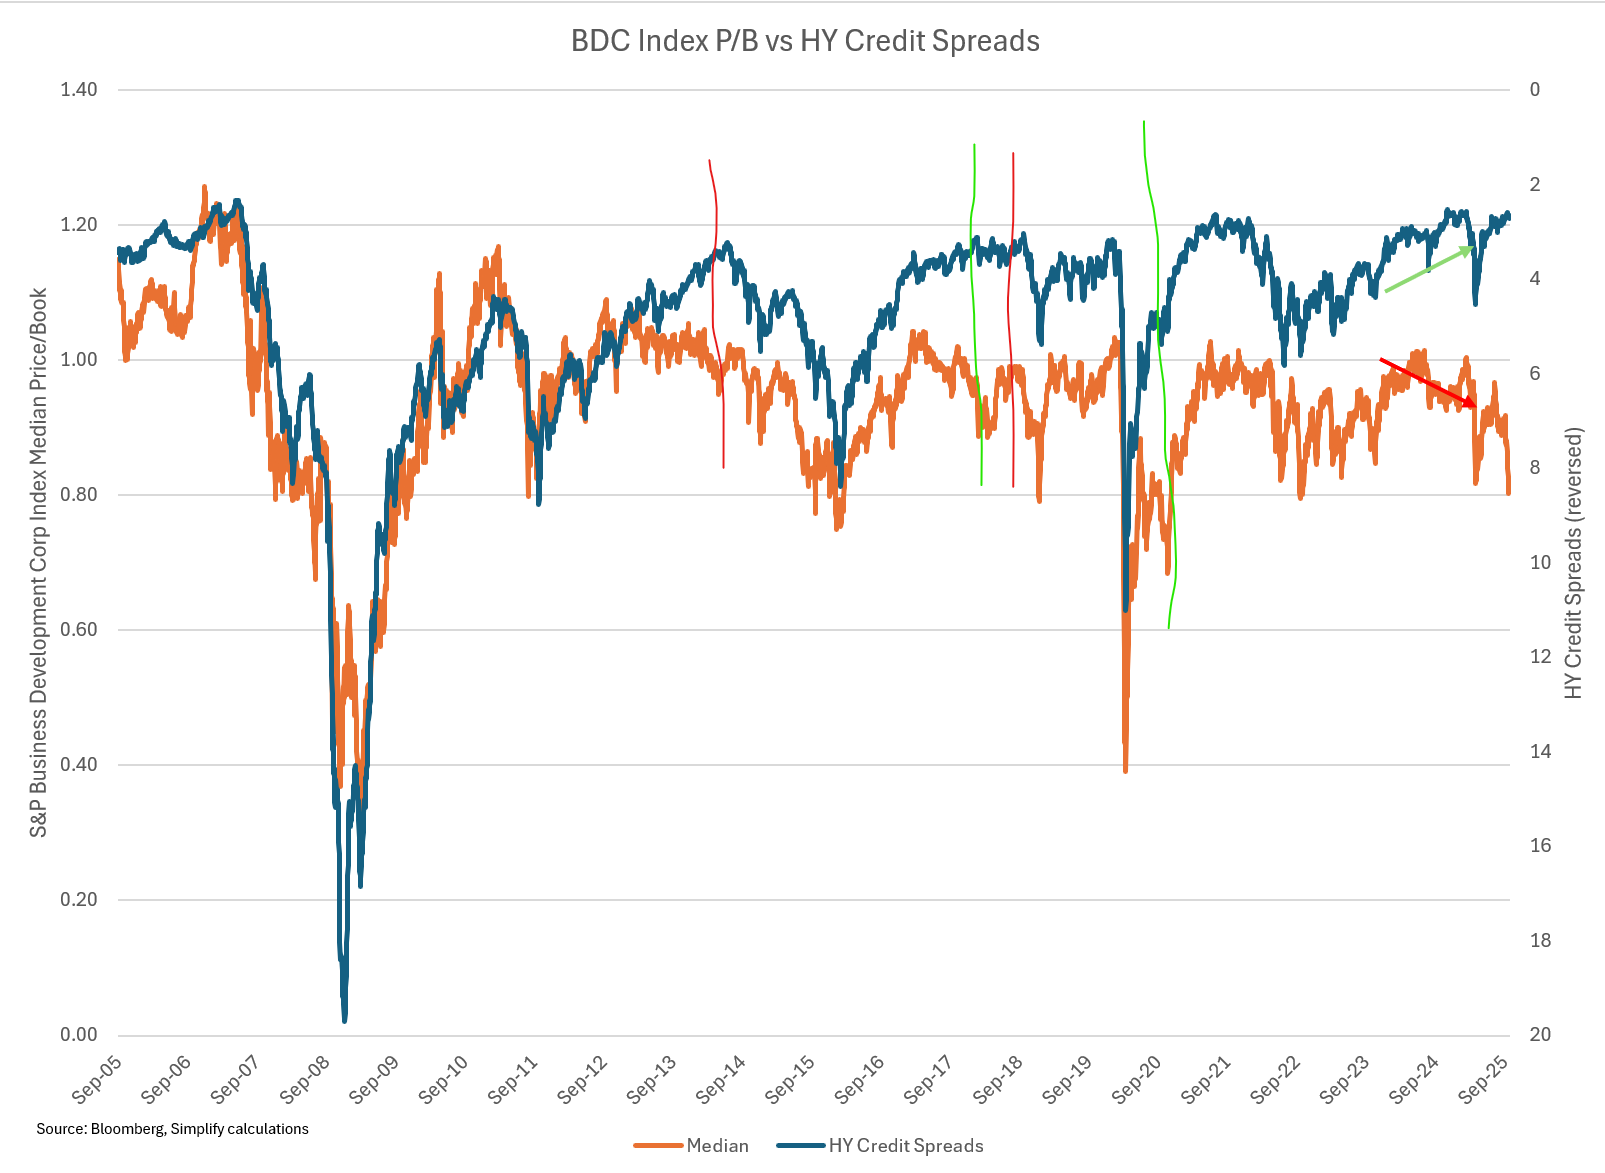
What YIGAFers know too early, others discover too late. BDCs are suddenly in the headlines. As noted, about half of BDC P/B vs HY spread divergences have ended favorably for BDCs and neutrally for HY (green lines). About half have resolved negatively (red lines). We are currently in the greatest divergence in history dating back pre-GFC. Got popcorn?
Setting the Record Straight on Vanguard’s “Setting the Record Straight”
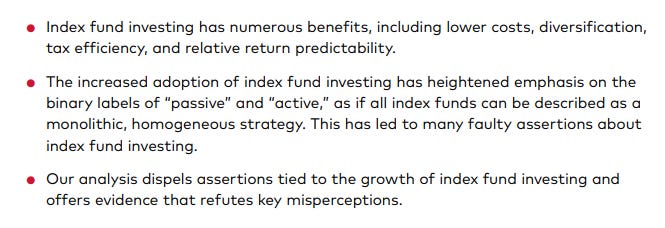
Why this matters
Vanguard’s August 2025 paper—Setting the Record Straight: The Truths About Index Fund Investing—arrives with a clear goal: swat down “myths” about passive and return the focus to low fees, diversification, and reliable benchmark tracking. Their emphasis:
However, the paper narrows the frame so much that the system-level consequences of indexing—how prices are set, how flows propagate, and how governance concentrates—are dismissed rather than addressed.
Below, I steelman Vanguard’s best arguments, then show where the case relies on selective scopes, apples-to-oranges baselines, or rhetorical deflections. I add the Jensen lens on agency costs when equity stays rich. And finally, I deliver a very specific ask of Vanguard. If you know a Vanguard advisor — or any advisor or regulator or random stranger — feel free to share a pdf of this post.
The best version of Vanguard’s case (steelman)
1) Index funds deliver what they promise. Low costs and tight tracking error to an outperforming index compound to meaningfully higher investor wealth versus the average active fund. (If you haven’t listened to the Rational Reminder podcast, I encourage you to do so, for no other reason than to understand how ACTIVE Vanguard admits to being in “passively” managing your assets. Regulators should take note.)
2) “Passive for active” is common. MANY investors don’t hold a pure total-market fund; they assemble tilts (style, sector, region). So realized portfolios often behave “active,” even if the bricks are index funds.
3) Investor trading of index funds are a tiny slice of reported trading. Using fund turnover data, Vanguard shows registered index funds are ≈1% of exchange volume, with no obvious link to aggregate market volatility.
4) Cap-weight doesn’t “add more” to the biggest stocks to make them bigger. A dollar of flow is allocated pro rata to current weights; in a perfectly elastic market, their basket math checks.
That’s the strongest positive reading of their paper.
Other than that, it’s garbage
A) “Index fund assets” ≠ “passive ownership”
The paper’s statistics are about registered index funds (mutual funds + ETFs), intentionally diluting market-cap weighted indices with style and sector funds. The academic debate concerns “passive” ownership using market-cap weighted indices —including target-date vehicles, direct indexing, SMAs, pensions, CITs, and closet indexing. When you aggregate exposures at the owner behavior level (not the product label), passive share is more than double the headline “index-fund” share. Vanguard acknowledges the Chinco–Sammon result and then explicitly limits its estimate to funds to keep cross-country comparability understating system-level passive behavior.
The question isn’t “how big are index funds?” It’s “how much capital behaves inelastically like an index?”
The answer? Well over 50% of market capitalization.
B) The “mid-cap peak” is a category artifact
Vanguard’s Figure 5 claims index funds own a higher proportion of mid-caps than large-caps, and uses that to argue they aren’t concentrating ownership at the top.
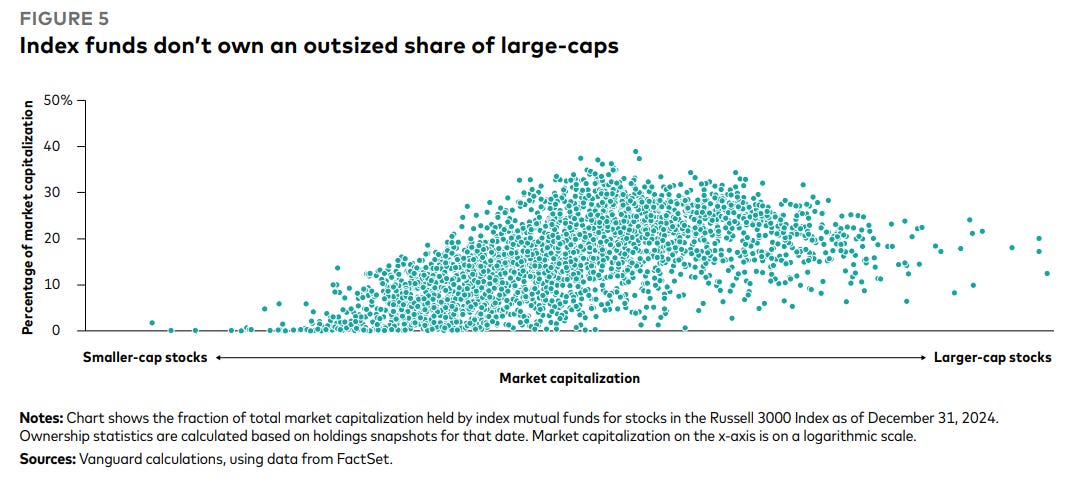
But look closely at how “index funds” are defined and grouped:
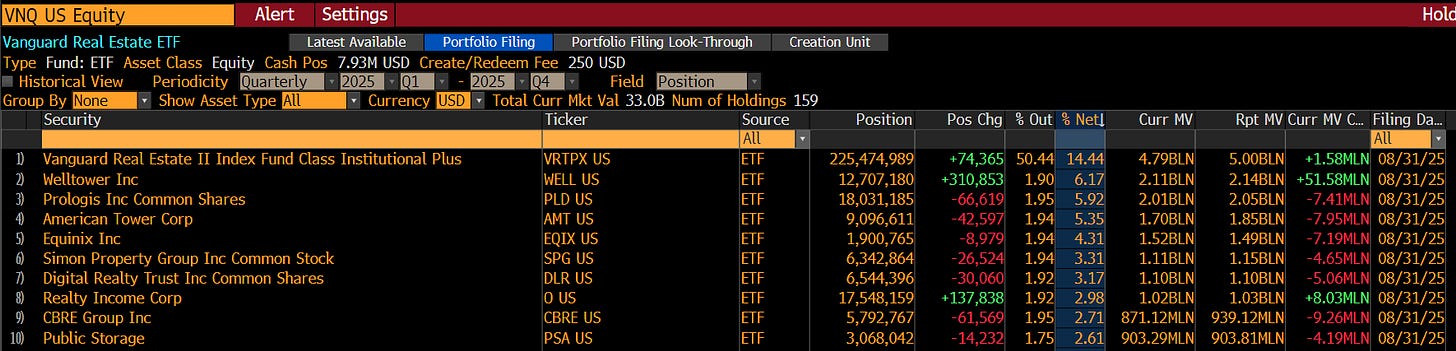
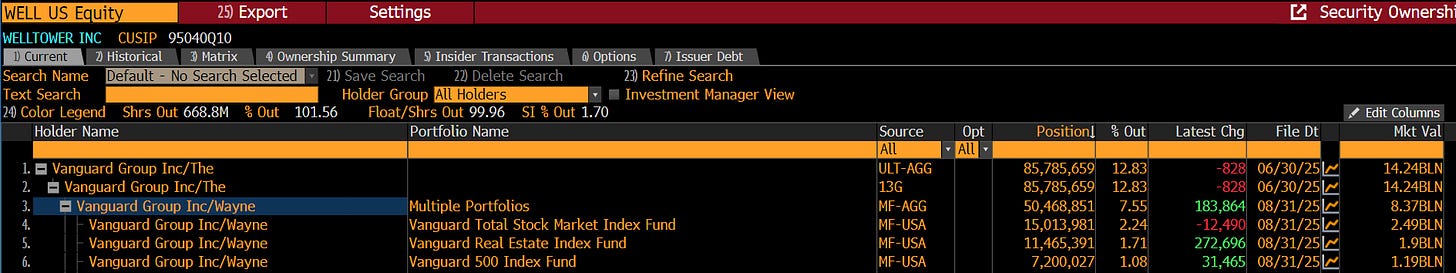
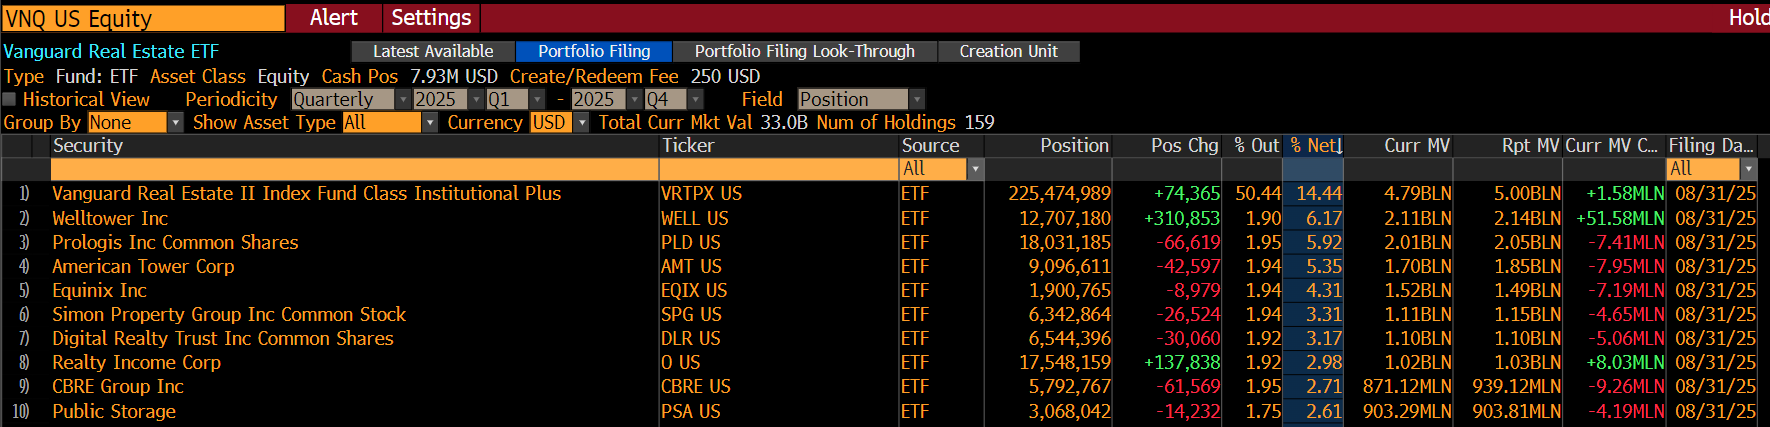
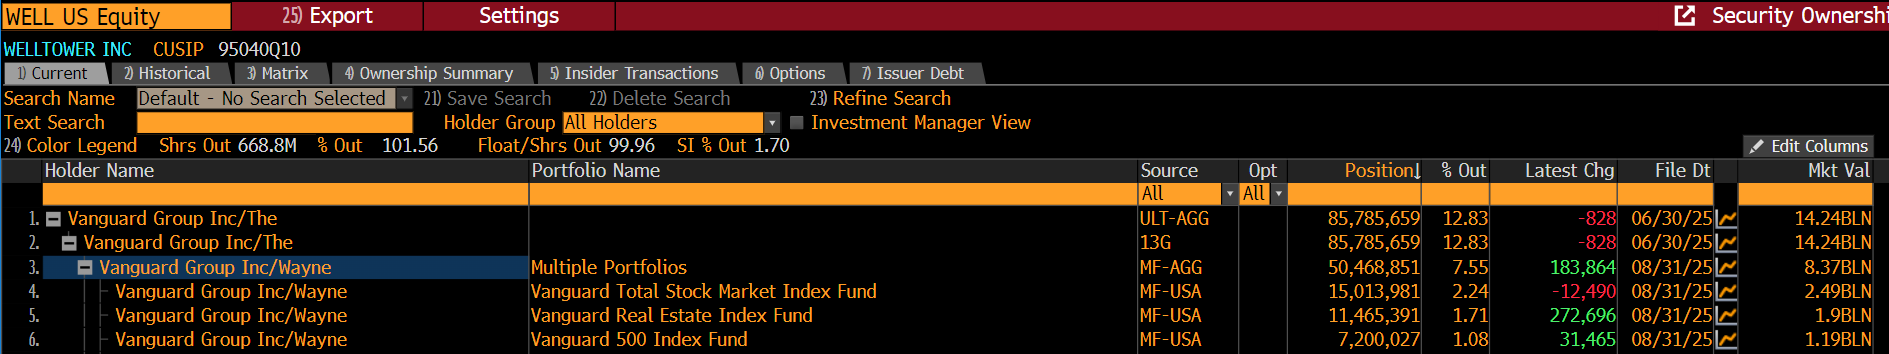
The dataset bundles sector and style products—many of which are not broad, cap-weighted market aggregates—into the “index fund” umbrella. By Vanguard’s own taxonomy, “U.S. Style-Based Equity” includes Mid Cap and Small Cap groups, and “U.S. Sector Equity” encompasses a huge number of sector benchmarks. As we have discussed ad nauseaum, and per Vanguard’s own argument that many investors use “index funds” (especially sector funds) to express macro bets, these are not “passive funds” in a useful definition. For example, US Real Estate, where Vanguard runs a modified market cap weighted fund, VNQ. This $33B fund owns as much of leading stocks like Welltower ($WELL) as does the nearly $2T Vanguard Total Market Index:
I agree — “not all index funds are passive” — so let’s not try to confuse the issue, Vanguard.
Figure 3 shows the explosion of non-total-market index benchmarks (e.g., style and sector indices) relative to true total-market benchmarks (tiny count) that Vanguard is intentionally using to deflect the issue. That proliferation naturally tilts measured “index ownership” away from the largest names and toward the mid-cap cohort most represented in those non-broad products which has never been a topic in the “systemic risk” discussion. Note also that they represent it as share of GLOBAL market cap. One point continually emphasized in the literature is that this is largely a US-centric issue, with other countries rapidly adopting the “passive” approach for retirement funds.

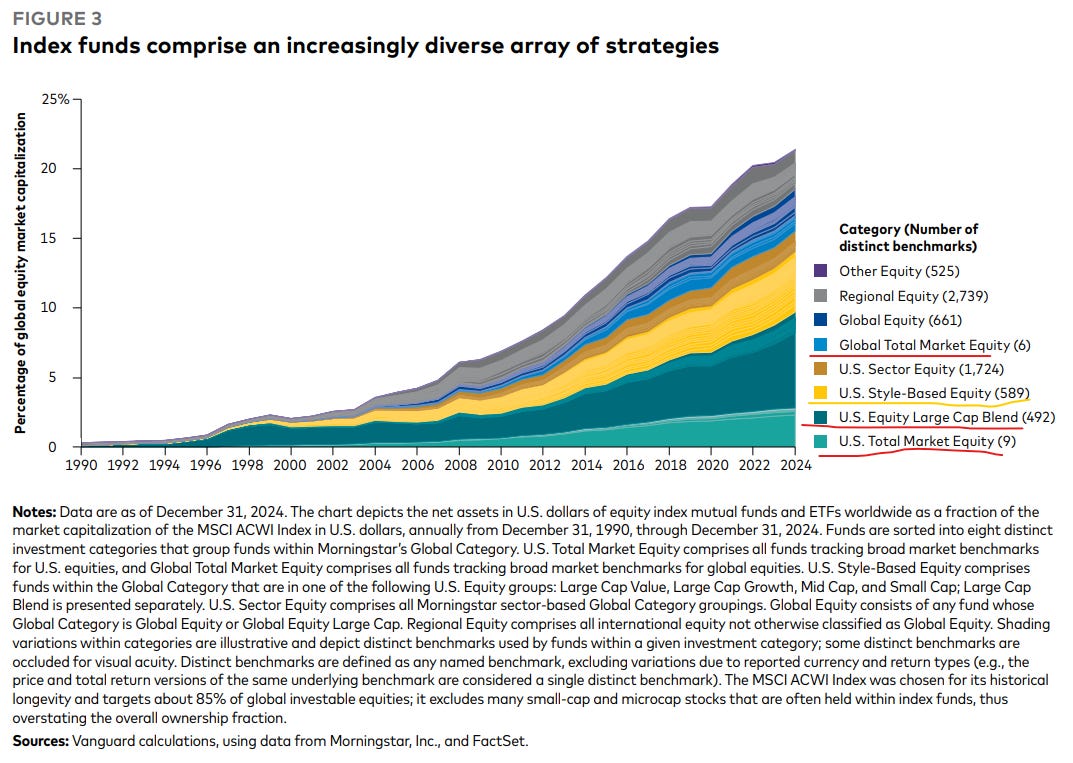
So when the paper says “index funds’ highest proportional ownership is in mid-caps,” much of that pattern reflects sector/style wrappers labeled ‘index’ rather than broad, cap-weighted “passive.” It’s a category-mix effect conflating “passive” with “index”, not evidence that passive, in the economically relevant sense, spares mega-caps.
C) Trading share ≠ Price impact (and the iceberg they don’t count)
Vanguard’s “~1% of trading” relies on fund-reported, cash-flow–adjusted turnover versus exchange volume—i.e., NET portfolio trades by the fund itself. That’s the tip of the iceberg.
Vanguard uses an intentionally deceiving, but hard-to-catch refinement to arrive at this statistic. Note the footnote in their analysis:
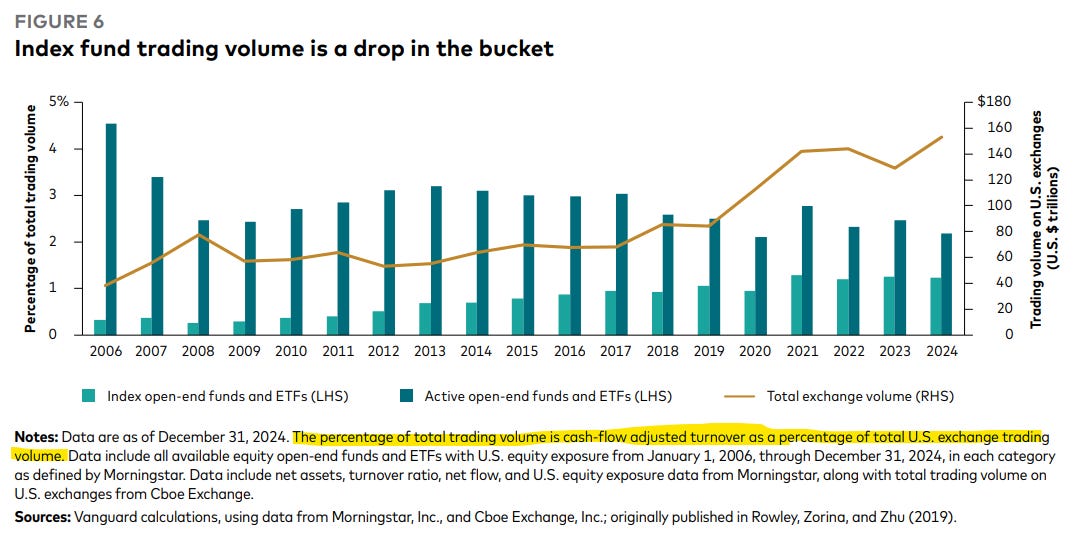
What is “cash-flow adjusted turnover”? I must confess, I had no idea. Fortunately, ChatGPT to the rescue:
“Short version: “cash-flow adjusted” means they’re using Morningstar’s portfolio turnover ratio, which backs out investor inflows/outflows so it only counts trading that changes the portfolio beyond what was mechanically required by net subscriptions/redemptions.”
WTF? So Vanguard is using a statistic that ignores the entirety of the insight that passive funds receive subscriptions/redemptions every day and are hence “not passive” by the academic definition.
So what this statistic confirms for us is that INDEX REBALANCING alone is ~1% of total transactions (and rising significantly). Inflows, outflows, gross redemptions, gross subscriptions, partial CU/RU, dividend reinvestment, etc. are ignored. And Vanguard knows this and is intentionally misleading regulators and the public.
Below the waterline sits the maintenance machine that must trade so passive exposure stays aligned with its benchmark:
Index maintenance: inclusions/deletions, float updates, GICS changes, and corporate actions force mechanical buys/sells. Even a buy-and-hold “market portfolio” must trade because the market itself changes.
ETF primary-market plumbing (CU/RU) + AP(authorized participant)/dealer hedging: creations/redemptions run intraday; APs hedge with cash equities, futures, and swaps. Most of that activity shows up as dealer/derivatives flow, not “fund turnover,” so it’s omitted from Vanguard’s numerator.
Investor cash-flow dynamics:
• Mutual funds batch at NAV and net/cross flows internally. $1.0mm buys vs $1.0mm sells ≈ zero external trading; $1.1mm vs $1.0mm triggers only $100k of executes, even though $2.1mm passed through the pipes.
• ETFs break that end-of-day netting; continuous CU/RU + hedging raises gross and net trading even when mutual-fund flows would offset. But even here, there is typically a batching of NET trades in units equivalent to CU/RU. You buy an ETF, the AP will accumulate shares of the underlying until delivering the “creation basket” to the fund company. No direct trading.
• As flows turn structurally negative, mutual-fund netting loses its cushion—external trades become convex in the imbalance (quiet, then suddenly all-sell).
Measuring “cash-flow adjusted” fund turnover and inferring “passive barely trades” is a category error. What sets prices isn’t passive’s sliver of headline tape; it’s the elasticity of the marginal price-setter who must absorb index maintenance, CU/RU waves, and flow-imbalance shocks.
D) “Cap-weight doesn’t make big bigger” misses the routing channel
Per trade, the basket is pro-rata. Systemically, net inflows into cap-weighted vehicles are routed most heavily to the largest names because that’s where the weights live. When the discretionary/active side is smaller or crowded, absorbing that flow requires larger price moves in the biggest names. The pro-rata arithmetic is true; it just isn’t the mechanism that determines prices. Routing + inelastic absorption is. Vanguard “helpfully” shows to independent hypothetical flows of ~100x magnitude to illustrate that both buy orders buy stocks in the same proportion:
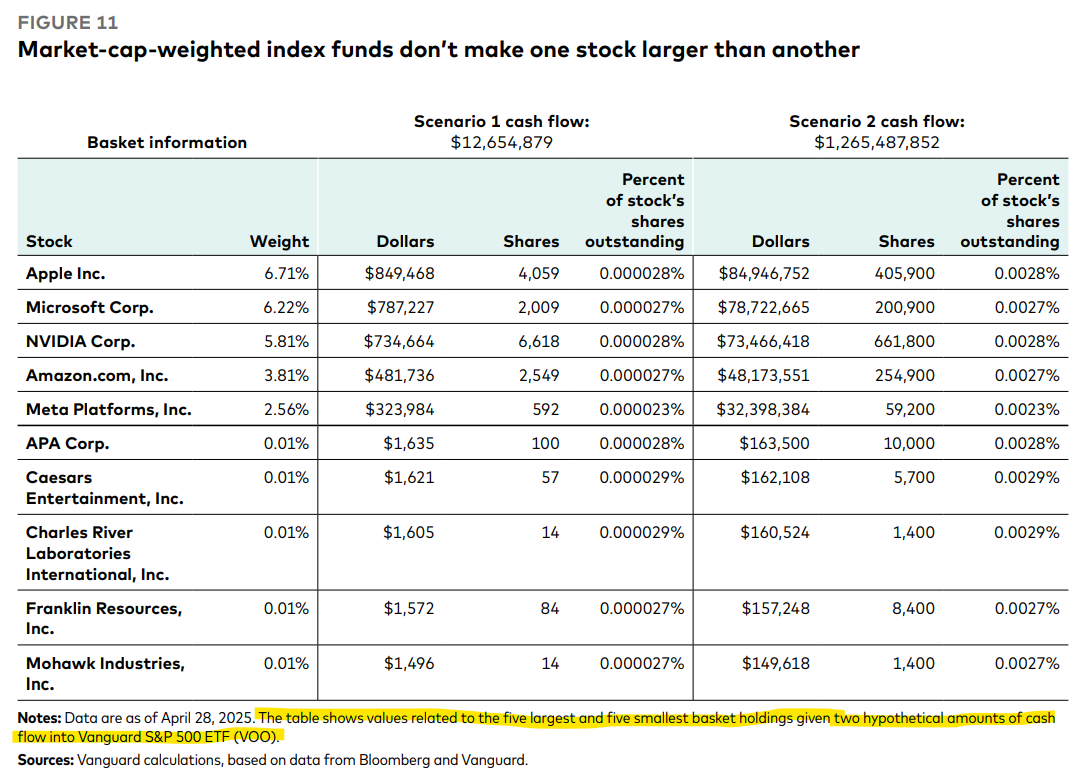
The question has never been whether the ALLOCATIONS were proportional to market capitalization, regardless of order size. In fact, the subject of my Rational Reminder podcast was to highlight that it’s not a question of whether they are ALLOCATING by market capitalization, but whether the MARKET IMPACT of those orders was impacting some stocks more than others. This is where authorship becomes important. In addition to Jim Rowley, we’ve got this guy — ooh, a finance PhD!

I wonder if Stephen Lawrence, PhD has ever written on liquidity:
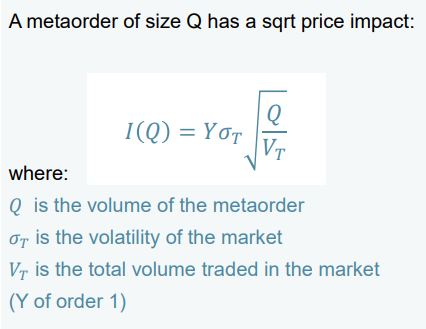
This Jan 2024 paper by Pingel, Lawrence, and Rodemer was published by Vanguard in the Journal of Investing. We know that this squares with the research of Bouchaud on Market Impact which specifies that the impact of an order of size Q scales proportionally to volatility and inversely to the square root of Q/volume.
If we evaluate whether “liquidity” scales with market capitalization, it’s a simple calculation — market cap on X-axis vs average 200 day $ trading volume. That Lawrence hasn’t done this calculation is unthinkable. The output is important, especially when we acknowledge two important outliers, NVDA 0.00%↑ and TSLA 0.00%↑ :
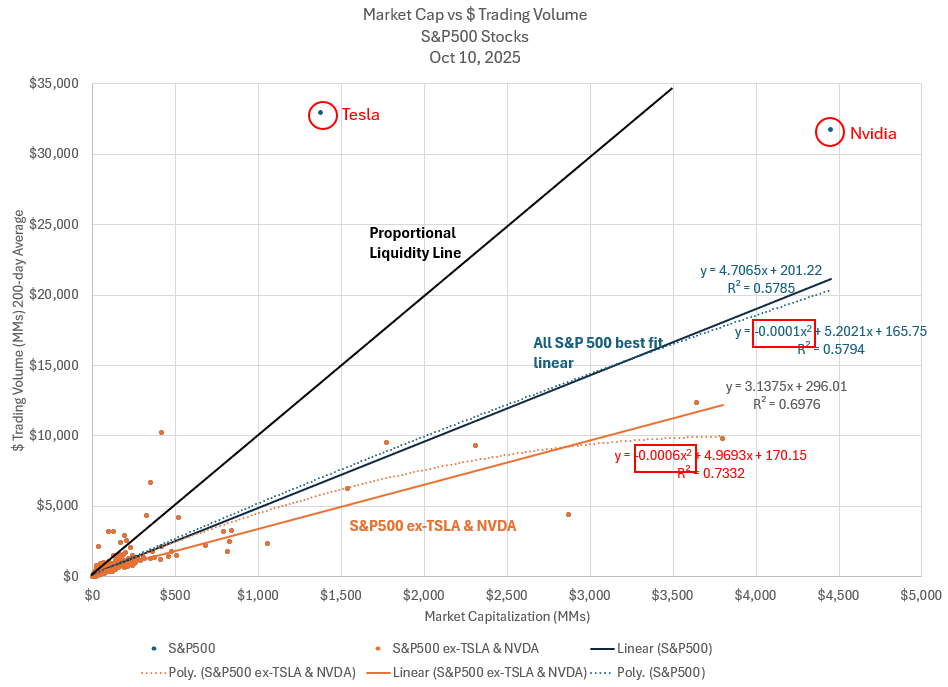
Would you look at that!?! There is no scenario where liquidity scales proportionally to market capitalization. In fact, polynomials of both with and without the outliers of TSLA and NVDA show a NEGATIVE second order impact of market capitalization. In other words, the larger the market capitalization, the BIGGER the impact of the market capitalization scaled order — surprise! surprise! a 100x larger order has 10x the impact (10=sqrt(100)). Let’s rewrite Vanguard’s table using trailing 200-day trading volume vs the size of the order they hypothesize. Note that I cannot quite create their proportional order sizes, but we’re close enough:
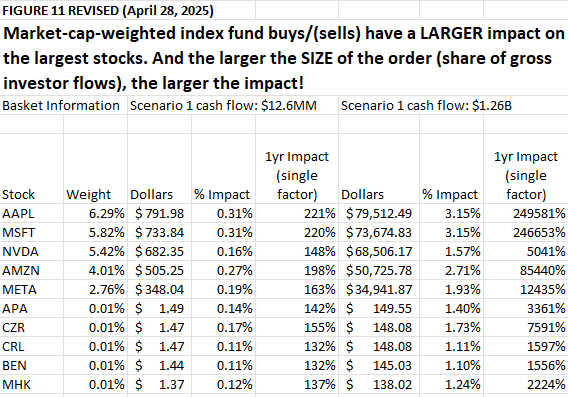
Note the extraordinary impact this SINGLE factor would have if not executed against an increase in supply. Where does that supply come from? Once again, we have academic insight, this time Sammon:
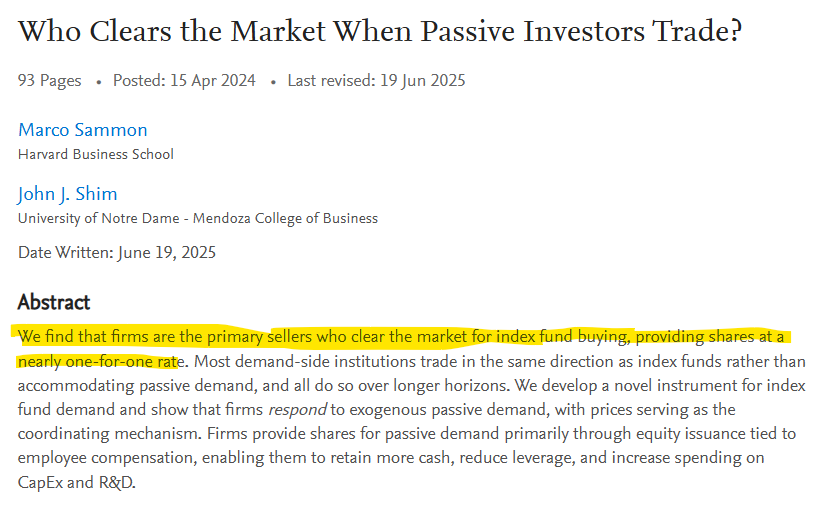
So congratulations, Vanguardians. You’re making corporate executives very, very rich.
Yourselves? Temporarily so: