Sins of the Father
The Volcker error of 1980 returns

Welcome to the final free edition of YIGAF. As Samuel Johnson noted, “No man but a blockhead ever wrote for anything but money.” Who am I to argue? I will be quite honest that it’s a terrifying moment because perhaps you do not value my work. I cannot blame you. But many of you have reached out to convey the opposite, and I have placed a meager price on the work. At an annual cost of $99, you pay less for my insights than for a weekly cup of coffee. With the Simplify discount, it’s perhaps even viewed as a bargain! Send a screenshot of an anonymized brokerage statement with Simplify products to yesigiveafig@regmanagement.net for your discount code. Emails will be sent out next week with confirmations and codes.
Starting next week, I will begin each letter by directly answering each note's “most popular” comment. The comments have proven to be a rich source of thought and inspiration, and I’d like to encourage more of this interaction.
The top tier of research is available to institutional subscribers, who will receive access to all spreadsheets and analysis behind each week’s notes as well as recorded “founder group” quarterly Zoom calls of unknown duration. Given my noted verbosity, bring coffee to these private events.
And finally, I genuinely mean it when I say, “No questions asked,” on free subscriptions at the basic level. If you can’t afford it and want to continue reading, please do! In exchange, I’d appreciate you sharing my work as broadly as possible. Reach out to yesigiveafig@regmanagement.net with any questions or requests.
And for those who choose to discontinue reading, I understand. My inbox is full as well, and I wish you all the best in navigating the years ahead. Thank you.
Summary:
The lagging "Owner's Equivalent Rent" (OER) metric in the Consumer Price Index (CPI) was created to address the unintended consequences of interest rate hikes on measured inflation during the Volcker Fed — unfortunately Chairman Powell is repeating these mistakes
Real-time metrics of inflation suggest the Fed is again way behind the curve
The release of the BLS’ Quarterly Census of Employment & Wages (QCEW) confirms hidden weakness in US labor markets
“The initial impetus for accelerating inflation in 1978 came mainly from the food sector, with some help from mortgage interest rates. The further acceleration into the double-digit range in 1979 mainly reflected soaring energy prices and, once again, rising mortgage rates. Finally, mortgage interest carried the ball almost by itself in early 1980.” — Alan Blinder 1982
Most readers will be familiar with the influence of the odd measure of US housing inflation, the “Owner’s Equivalent Rent,” on CPI. Fewer are familiar with WHY we use this metric instead of far more timely metrics. That story ties back to the experiences of the last great inflation in the United States and the sordid tale behind the unnecessarily deep recession of 1980. As chronicled by Alan Blinder in his 1982 paper, The Anatomy of Double-Digit Inflation in the 1970s, the inflation of the 1970s was a global experience initially driven by supply disruptions in food and energy.
Sound familiar so far? Unfortunately, inflation took a darker turn when Central Planners began to machinate and attempted to control inflation with interest rate hikes. These hikes perversely RAISED measured inflation due to the direct impact of higher interest rates on the prices being measured — namely monthly mortgage payments. This higher measured inflation led Paul Volcker to conclude that if 1000bps of hikes had not done the trick at conquering inflation from 1976 to 1979, perhaps an additional 300bps would do the job. Unless you believe that the “long and variable lags” suddenly became short and immediate effects, these hikes accomplished nothing. And then in a fit of perversity, with inflation already falling not only in the US but globally, Volcker proceeded to hike interest rates again… just to be sure. This fateful move led to an increase in the “core” metrics, including housing, that directly referenced interest rates themselves and took a relatively mild recession into the record books. Unemployment, which had risen a minor 200bps in the 1979 recession largely due to labor force growth, rose an additional 400bps and over 4MM Americans were put out of work. All occurred well after inflation had clearly begun to recede. Volcker’s subsequent intransigence at cutting rates is largely responsible for the modern outsourcing of American industry. Why build plants when raiding over-funded corporate pension funds is so much more profitable?


In a minor mea culpa, in 1983 the BLS switched from the use of the marginal mortgage rate to the now-derided Owner’s Equivalent Rent in an attempt to prevent these types of snafus in the future. And all was well until 2021 when, among others, well-coiffed hedge fund manager Bill Ackman opined on the “imprecise” issues of OER in December 2021:

While Bill was, of course, wrong about the specifics of OER (the survey is largely irrelevant as the index is composed of a panel of rotating rental properties), his broader point was certainly accurate. In December 2021, OER was 3.5% and headed higher while real-time metrics of housing costs, like Zillow’s real-time “Observed Rent” indicator, was 16.4% (and unknown at the time, peaking).

Recognizing that the Fed’s lagging measures of inflation were leading them astray, Jerome Powell pulled up his bikini briefs (hunch, no direct knowledge) and proceeded to take the American public for another ride in pursuit of a “Volcker-esque legacy.” Somewhere along the way, in a nod to the lagged nature of OER, the Fed adopted a new, new metric — “Core Services ex-Housing”. The term “core services” was, for all intents and purposes, “new” — apparently an attempt to distract from banned “transitory”:

As Powell hiked indiscriminately in pursuit of the Jabberwock, I noted in July 2022 that the tools he was using were likely to drive inflation ultimately higher even as they would eventually demolish the economy. Both events are now coming true:

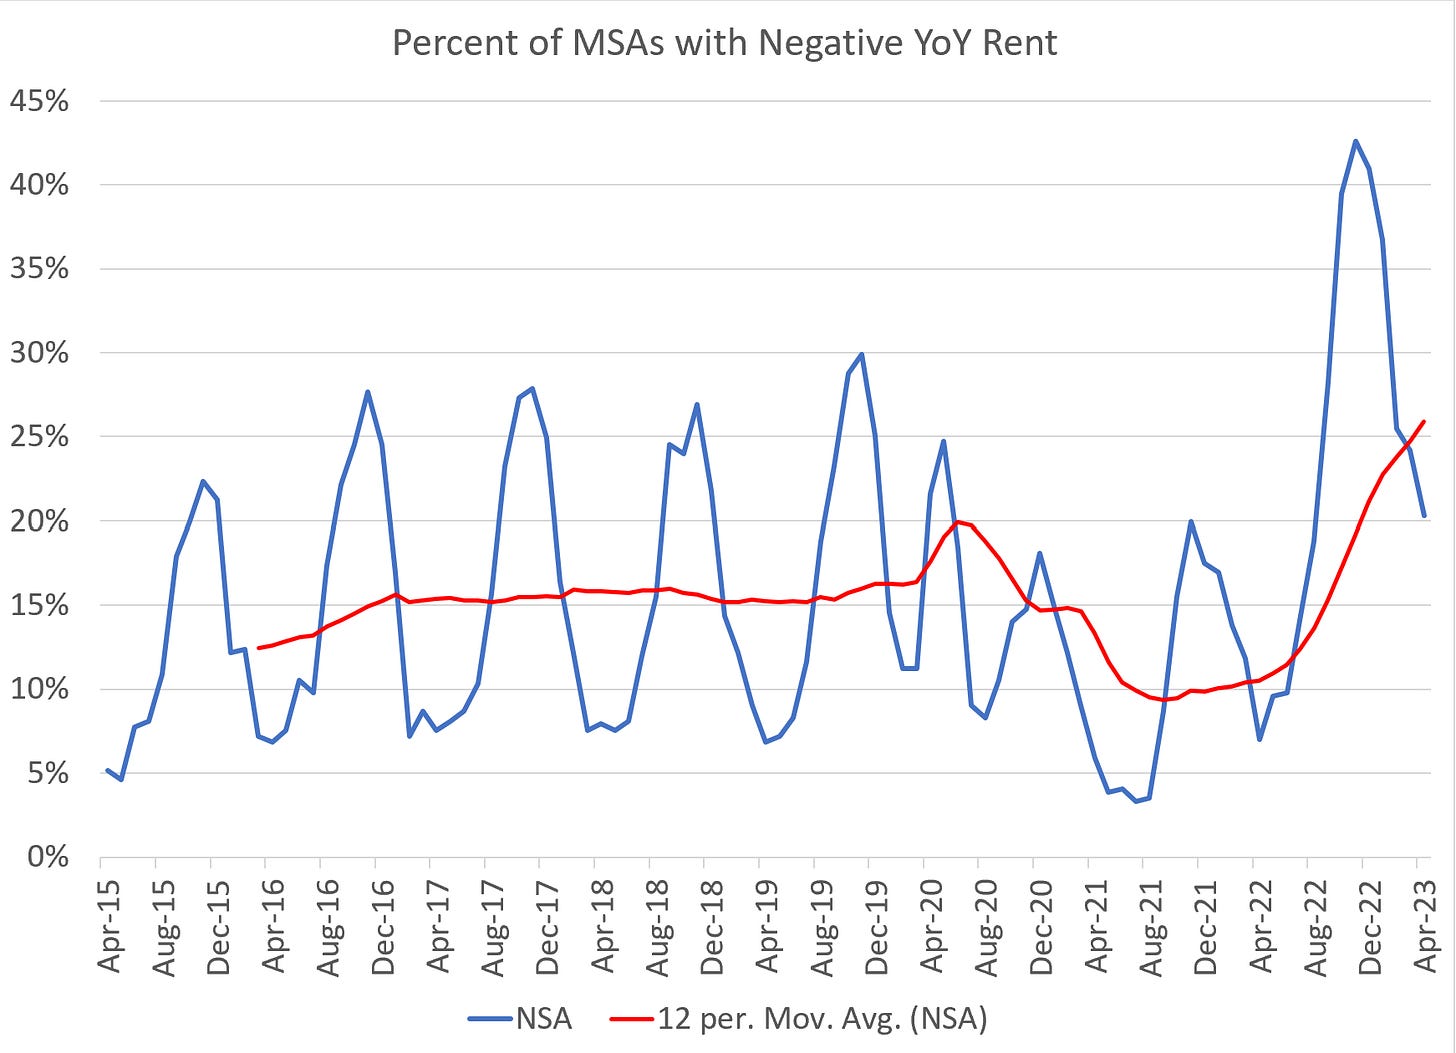
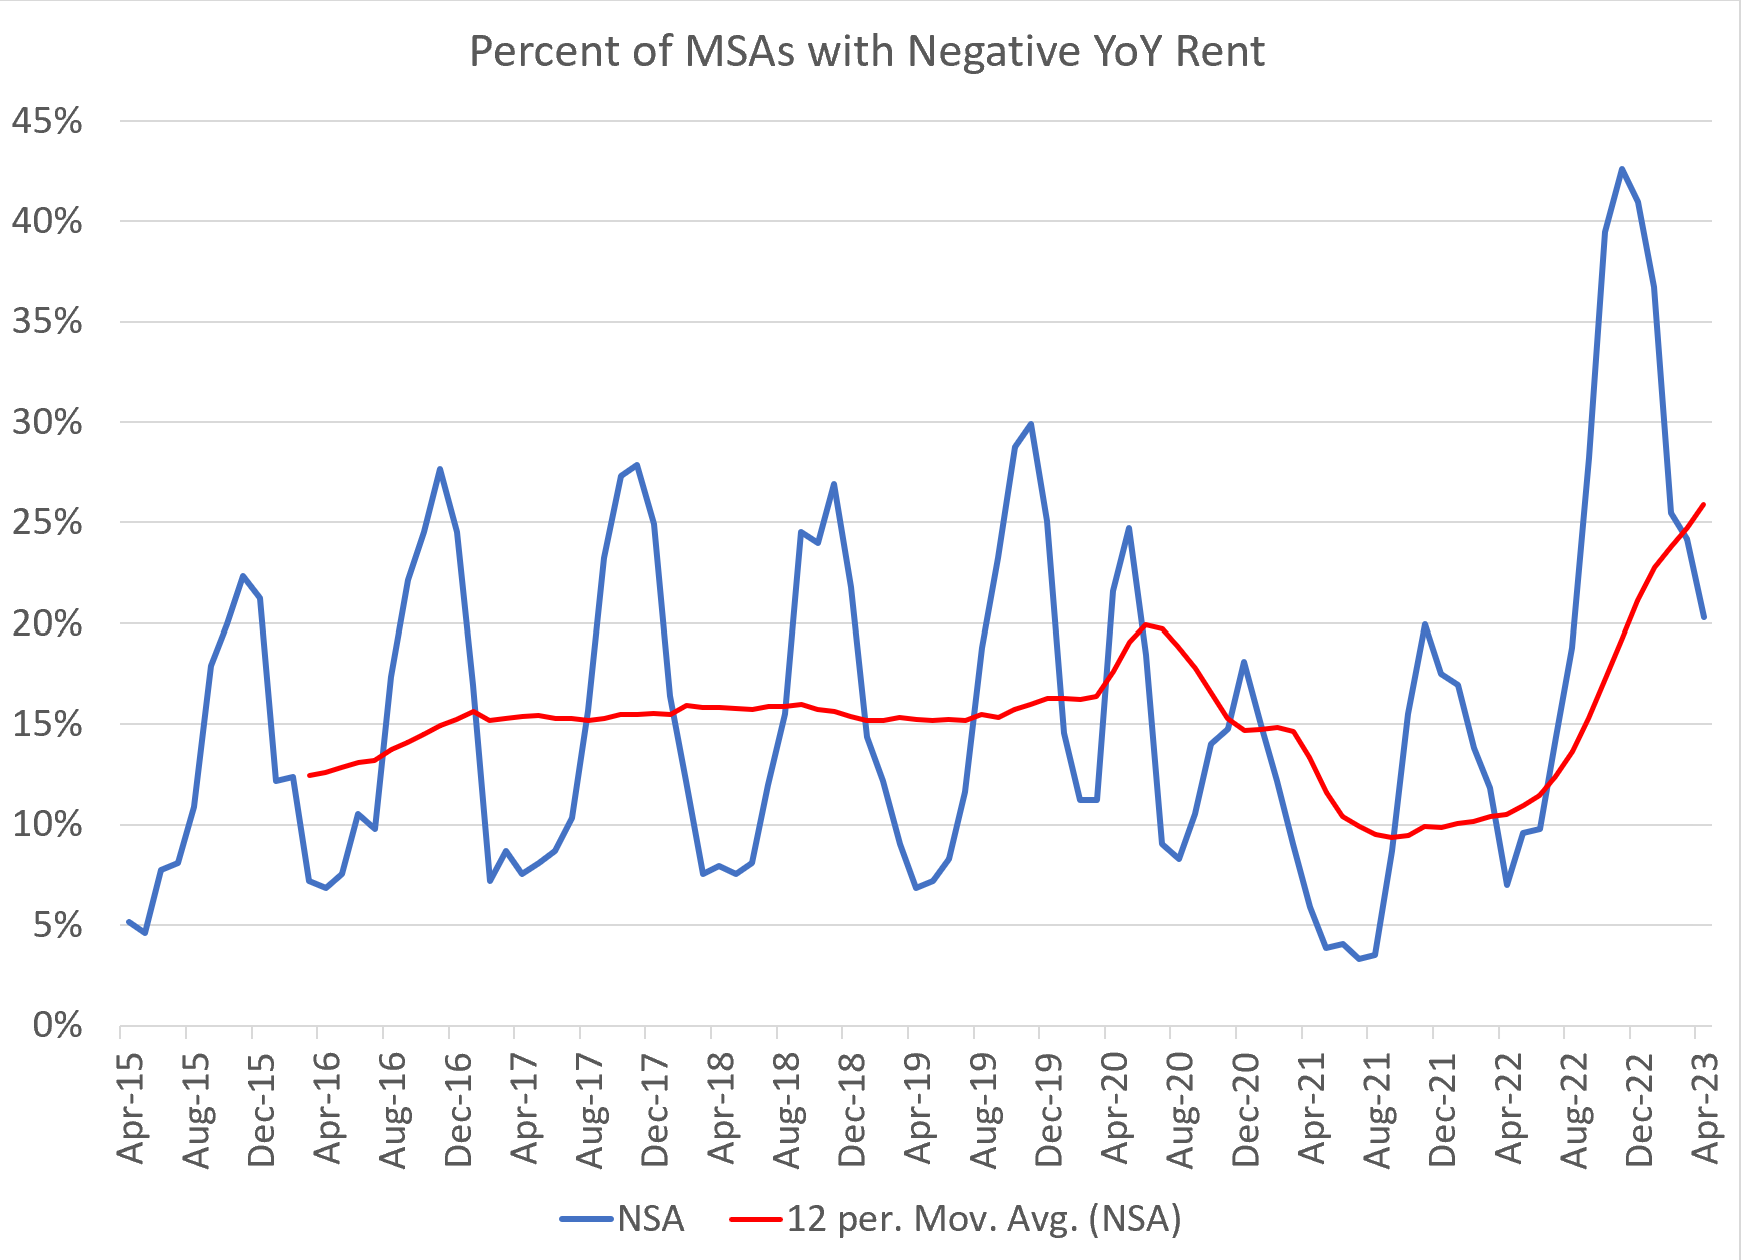
Today, the metrics on shelter inflation are flipped and the Zillow index is at 5% while OER is north of 8%. However, that Zillow index at 5% conceals some important facts:
A record number of MSAs are now experiencing negative rents
The “strength” in the housing market is impossibly narrow with near-record low sales of existing homes momentarily offset by record low inventory. Remember how you bought toilet paper whenever you saw it in 2020? Low inventory makes product move. Unfortunately, the best cure for low inventory is unemployment. I’ll share a personal analysis I did for my realtor in the process of selling my own home (yes, I’m talking my book, but the data is much more “true” at the local level across all regions):
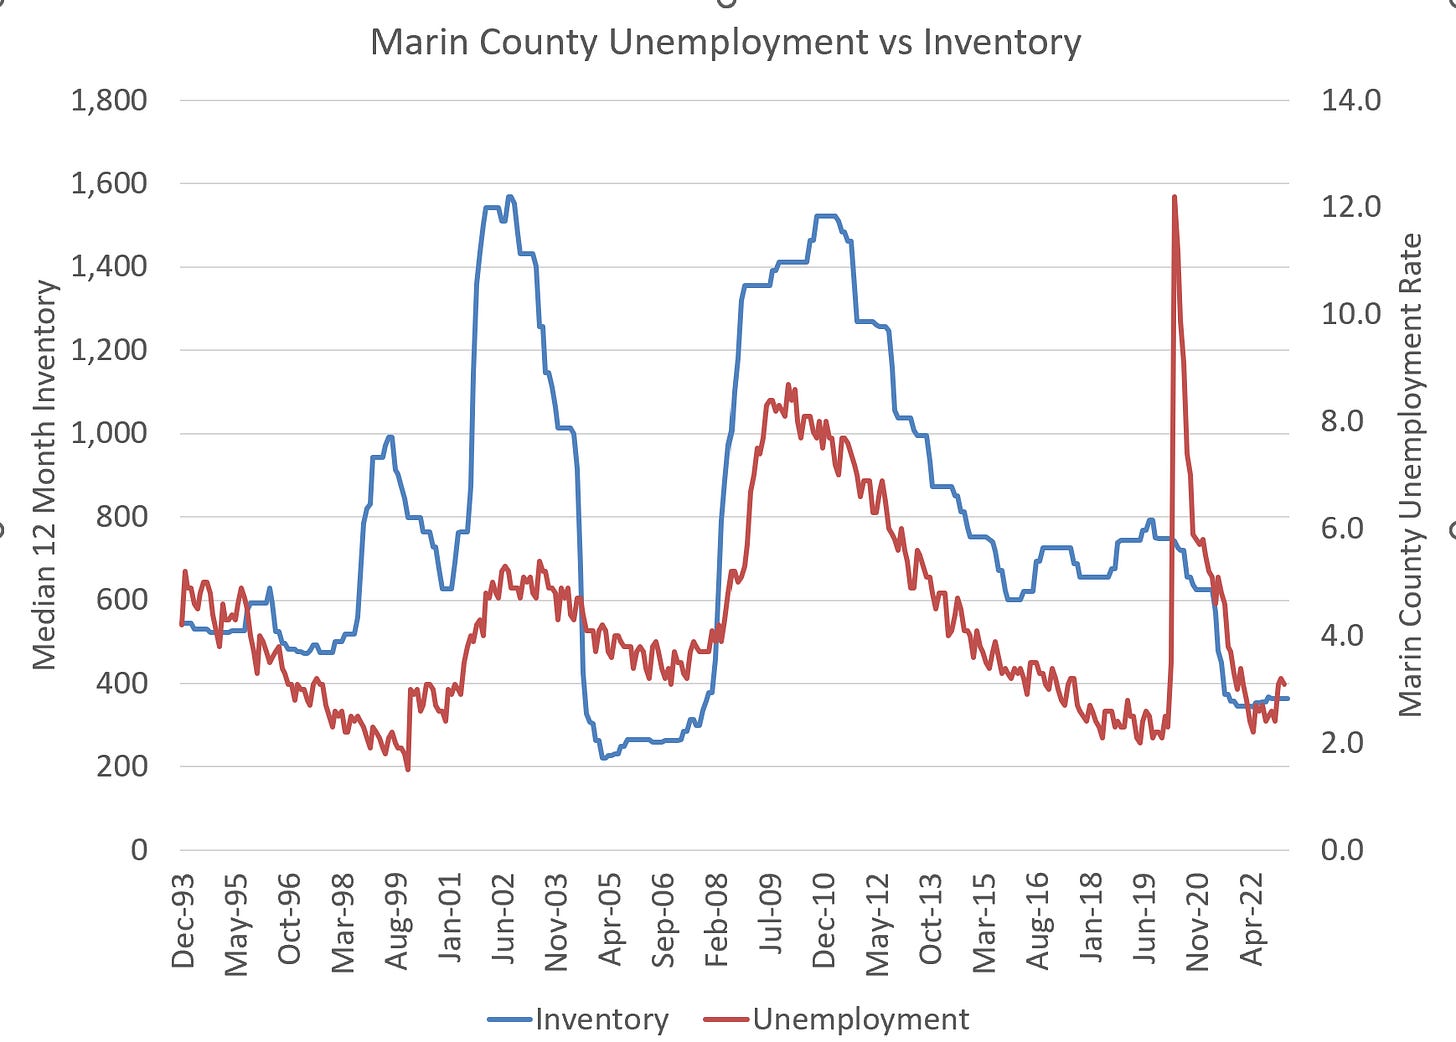
As discussed in “Remains of the Day” and “Burning Down the House”, the labor market is tight at the low end, while actually on the verge of looseness at the high end (hence a desire to flee Marin). This week the Bureau of Labor Statistics added evidence to this outlandish claim with the release of the Quarterly Census of Employment and Wages. Labor compensation actually FELL in 2022. Not only in real terms but in nominal terms. This is exceedingly rare and completely incompatible with the narrative of a strong labor market:


And if we continue to push on this thread, we discover that, exactly as we had hypothesized in last week’s note, the damage is coming from the high end:
“The QCEW figures differ from other government measures of wages in that they include things like bonuses, stock options and severance pay.”
From last week’s YIGAF in reference to the oft-cited Atlanta Fed Wage Tracker:
“Does anyone else see a problem in a data series that ignores the top 15% of workers in a recession that appears to be LED by the top 15% of workers losing their jobs and facing diminished earnings prospects?”
Finally, just like his hero, Tall Paul, Jerome has managed to begin creating his own inflation. Roughly 20% of the “Core Services ex-Housing” metric includes factors that are directly tied to the level of interest rates. You might be surprised to discover that “mutual fund fees” are soaring (they are not). This is tied to securities margin lending costs driven by Fed hikes:

Motor vehicle leasing rates (included in services, not goods) are soaring with Prime rates (again tied to Fed rate hikes):


And even banks are apparently taking us to the cleaners as the methodology for determining the “cost” of bank deposit services is calculated as “the spread between the rates on bank deposits and the risk-free rate”:

These are obviously just as stupid as “the prevailing mortgage rate” for determining the cost of housing:

I spent a good chunk of Friday on the phone with various contacts in the government. Depending on their political alignment, the reactions varied from glee, “Who’s going to cry for the overpaid tech worker as long as the low end is finally getting some gains” to the slightly soberer, “The economy is about to have a heart attack.” I lean towards the latter interpretation.
As always, questions and comments are very much appreciated.
I remember the Volcker era recessions very well, as I graduated from college in '79 and then Law School in '82. Those classes represented children born in 1957 which was the "crest" of the wave of Baby Boomers-4.3 million kids born that year, who were all entering the job market during the Volcker recessions. I lucked out and found a good job by spring of '83. Ironically, one of my classmates who ended up being one of the most sucessful lawyers from our class (head of Bankruptcy, Reorganization, M&A practice at a major int'l law firm) could not find a legal job and went to work at a major accounting firm for a few years, before he lucked out and landed a clerkship with a Federal Bankruptcy judge he had previously interned with. I hope that history will not repeat itself for the sake of all the young people entering the work force, but I agree with you things are likely to get very tough given current Fed policy.
Thanks Michael. Really appreciate your work even when it appears you might have a bias or let emotions distort your analysis (hey we’re all humans with these darn tricky emotions).
Definitely subscribing. Very fair price.
And thanks for the reminder about the QCEW report!
Lastly, I’m surprised that second homeownership is only 5%. Is any of the data skewed by the fact that many “second homes” are also part time AirBnb (as opposed to the second homes that are used exclusively by the owner) and might not land in the 5%? Seems like a lot of gray area between traditional second homes and part time rentals vs full time rentals?
Are the rest of the Airbnb is owned by corporate entities that don’t show up and that number?