Signs of Artificial Intelligence at Work
What can market structure tell us about the 2023 risk markets?

Summary:
Market behavior is influenced by inelasticity which has increased with passive investing.
Systematic portfolio rebalancing due to Fed rate hikes and the rise of passive investing explain a significant portion of 2022’s market behavior.
In 2023, inelasticity, driven by price-insensitive quantitative strategies and sector ETFs, is contributing to market distortions and the divergence between different stocks
A reminder that this week is the start of the YIGAF paywall. We have also transitioned over to the yesigiveafig.com domain to avoid Twitter’s Substack suppression. We will be setting up institutional accounts in the coming week and these accounts will receive links to a Google drive that has all the analysis used for this note. As always, we offer 50% discounts for Simplify ETF users and full YIGAF scholarships upon request. Please email yesigiveafig@regmanagement.net to obtain either. Thanks for reading!
Top Comment from Last Week:
James Robertson: I remember the Volcker era recessions very well, as I graduated from college in '79 and then Law School in '82. Those classes represented children born in 1957 which was the "crest" of the wave of Baby Boomers. 4.3 million kids born that year, who were all entering the job market during the Volcker recessions. I lucked out and found a good job by spring of '83. Ironically, one of my classmates who ended up being one of the most successful lawyers from our class (head of Bankruptcy, Reorganization, M&A practice at a major int'l law firm) could not find a legal job and went to work at a major accounting firm for a few years, before he lucked out and landed a clerkship with a Federal Bankruptcy judge he had previously interned with. I hope that history will not repeat itself for the sake of all the young people entering the work force, but I agree with you things are likely to get very tough given current Fed policy.
Mike: Great perspective. The role of demographics in the “stagflation” of the 1970s is critical to understanding the period. Volcker did not appear to understand this as there were zero discussions on this topic in Fed minutes. I often highlight the strong overlap between the demographic factor, “Growth in Labor Force” and forward inflation metrics. As the post-Covid inflation shows clearly, this is not the ONLY reason inflation can rise, but it was a key contributor to the persistence of inflation in the 1970s that is notably lacking today.

The Main Event
Over the last week, I've had the chance to talk to a number of people about what's happening in the market from the perspective of inelasticity and passive investing. It's fascinating to watch the market simultaneously be distributed, meaning I'm seeing more shares sold than bought, even as we're watching markets rise in what feels like an uncontrolled manner. More and more people are asking me, “What the hell is going on?”
My assessment, unsurprisingly, is that we are seeing a combination of factors in play. It’s helpful to start with an assessment of what transpired in 2022, which builds off the work of Jonathan Parker, Hanno Lustig, and X Lu in what’s called the “portfolio rebalance channel.” In the simplest model, imagine you are a systematic rebalancer of a portfolio that is 50/50 bonds and equities and that you are required to maintain this rebalance on a monthly rebalance schedule. A Deus ex-Machina actor, the Fed, decides to raise rates. Simplistically, given the duration of your bond portfolio, what must happen?
Period 0: 50/50 bond/equity. Portfolio value $100
Period 1: Fed hikes rates by 25bps against a 7.2 duration bond portfolio. Bonds fall 2%.
Period 2: Portfolio is overweight equities and must sell equities and buy bonds to rebalance. New portfolio is now 49.1/49.1 bonds/equities and value of portfolio is now $98.2
…. etc, etc. Let’s run this out for the six Fed hikes in 2022 and compare the results to an actual 50/50 rebalanced VTI/BND portfolio.
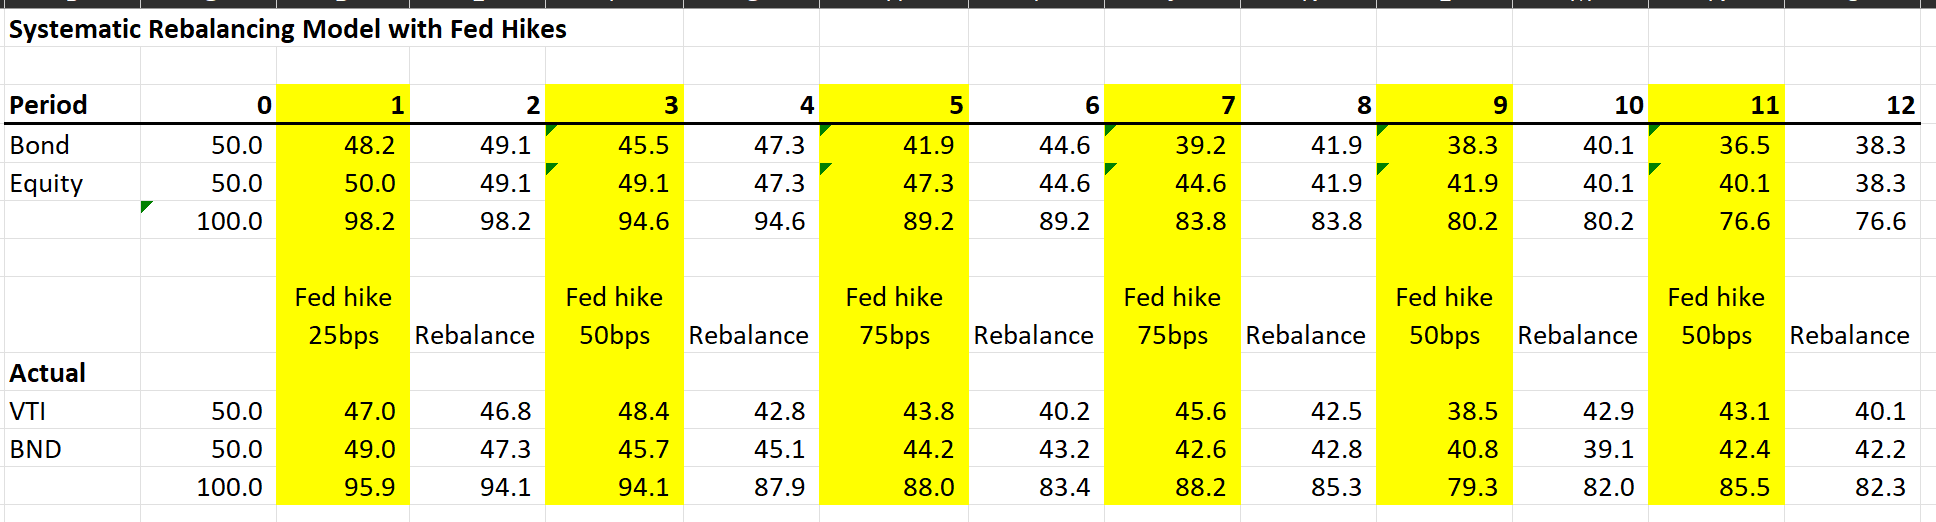
If we show the results in XY form, we discover that this naive model with ZERO information on anything other than Fed actions explains roughly 72% of the behavior of a 50/50 bond/equity portfolio in 2022. This is consistent with the recent X Lu paper which suggests ~2/3rd of the financial market impact comes through this portfolio rebalance channel.

A close observer of the data will notice that the relationship is non-linear. As the Fed hikes interest rates, the duration of the bond portfolio ends up falling and we experience a decreasing net impact. This fits both theory and empirical and the relationship grows even stronger (R-sq rises further to 74%). If we replace Fed Funds with the appropriate benchmark bond rate, e.g. the 7yr, the fit rises higher still. And suddenly the October bottom in equities becomes somewhat clear — this was when the rates market signaled, “No mas, Senor Powell”:

Now position yourself in 2023 where to a certain extent the opposite is happening. Equities rally while bonds are still pressured by Fed hikes (albeit moderately now that they are only 25bps and duration has fallen closer to 6.1). Equities up, the portfolio is overweight equities, sell equities, buy bonds. Rinse, repeat. With equities rising sharply into June while bonds have retreated on fears of a June hike, theory suggests an equity correction on the next rebalancing.
