Part 3: The Pursuit of Happiness
What went wrong? And introducing the "Rule of 65" for a first pass on solutions.

“The true justice of a nation lies in its faith faithfully observed.” — Alexander Hamilton, Report on Credit, 1790
Once again we’ve got a lot of new readers. I’m going to COMPLETELY dispense with market commentary this time as this piece is simply too long. I apologize in advance for the length and hope you make it to the end.
Part 3: The Pursuit of Happiness
When Thomas Jefferson sat in a steamy room in Philadelphia in June of 1776, he had a copy of John Locke’s Two Treatises of Government in his mental library. Locke, the godfather of liberalism, had a very specific trinity of natural rights: “Life, Liberty, and Property.”
For a landed gentry class, this was the ultimate slogan. “Property” is the defense of what you have already accumulated. But Jefferson did something radical. He took his quill and scratched out “Property.” In its place, he wrote: “the pursuit of Happiness.”
This wasn’t a poetic flourish, nor was it an attempt to dispossess others of their property. It was a structural shift in the American operating system driven by Jefferson’s mistrust of aristocracy and finance.
Scholars can debate whether Jefferson meant to diminish property rights, but the practical effect is undeniable: he elevated human potential above static accumulation. That philosophical shift matters because societies build what they choose to honor.
“Property” is a noun; it sits there. “Pursuit” is a verb; it moves. “Happiness”—in the Aristotelian sense of eudaimonia—is not about pleasure; it is about flourishing, capacity, and the realization of potential.
By choosing The Pursuit of Happiness, Jefferson prioritized future potential over past accumulation. He chose the worker over the rentier. He chose the builder over the squatter.
For much of the last 40 years, the United States has drifted into a nightmare. We have built an economy optimized for Property, not Pursuit. We tax wages (pursuit) heavily, while subsidizing debt and capital gains (property). We protect incumbents with regulatory moats while starving new entrants. We have let the “Property” of the Baby Boomers cannibalize the “Pursuit” of the Millennials and Gen Z.
We have valued the preservation of asset prices above the creation of national wealth.
In Part 1, we identified the “tree” — the hidden precarity for many American families
In Part 2, we outlined the “asset lie” for most participants (and supported Part 1)
Today, in Part 3, I promised solutions. I lied. Kinda. I will propose the solutions at the end in a format that allows you to run them through any LLM to test them yourself. Don’t take my word for it. But before we get there, we need a bit more diagnosis to understand what went wrong.
Are We Wrong?
Much of the criticism of this series to date has focused on the diagnosis — “Is $140K the new poverty line?” rather than a discussion of how we got here. While think tank economists remain unconvinced that your life is not better than ever, the overwhelming feedback has been, “Yes! This is my ‘life’ and I’m not very happy with it.” One of those economists went so far as to highlight his prior work that “people be stupid.” This explains the approach of “If we just keep highlighting how good things are, eventually they’ll submit.”

I hope you’re mollified (you can look it up if you didn’t go to Hahvard). Except this is a pretty nice reminder that most experts are expert in one subject. An entomologist knows a lot about Ents and little else. This “expert” is not an expert in statistics, but he’s clearly heard of the two-axis chart crime that is sweeping the nation. Unfortunately, this led him to commit a different type of error — Variance Masking (or simply a Normalization Error).
By plotting a low-volatility metric (Personal Satisfaction) on the same raw scale as a high-volatility metric (National Satisfaction), he crushed the signal of the former. He treated a ‘5-foot tsunami’ as irrelevant because he plotted it next to a ‘50-foot mountain,’ ignoring that water isn’t supposed to be 5 feet high in your living room.
When you normalize for historical volatility (Z-Scores), the divergence vanishes. The ‘vibes’ aren’t wrong; the chart is. And a correct analysis perfectly matches other measures of sentiment.
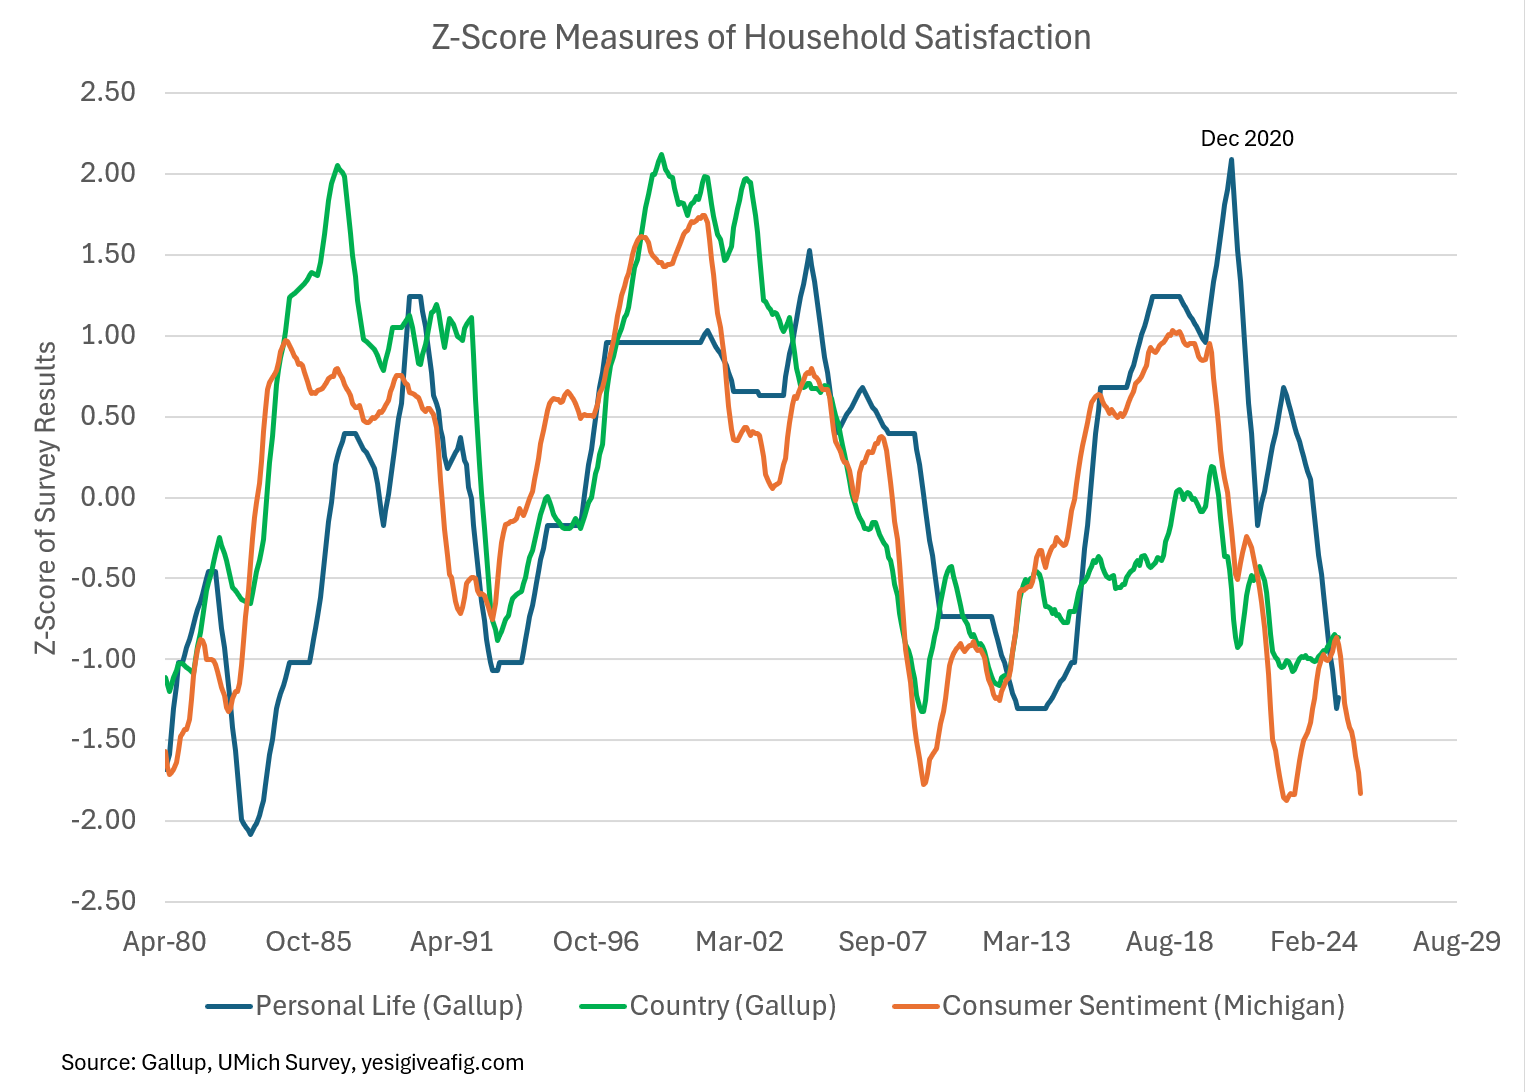
We’re miserable, and we know it. There is no “fake news” on the affordability crisis. I wrote on the topic of sentiment earlier this year in a piece called “Getting Sentimental” that identified it wasn’t traditional measures of economics that drove the collapse; it was trust. I confess that this was before I fully appreciated the story we are discussing today, but I remain convinced that this is the real story — we no longer trust our leadership to work to make our lives better.
So What DID Go Wrong?
The single most important chart I can share is the following — the collapse in labor share of GDP. There are several valid technical approaches to measuring labor share, but all reputable methods—BEA, BLS, OECD—show the same downward trajectory. The trend is not a measurement artifact; it’s a structural fact.

You’ll obviously notice the three red lines. In my opinion, these are the structural changes that drove our “decline.” The first, Kennedy’s Executive Order 10988, allowed the establishment of public unions. It was part of his deal with the AFL-CIO for support in the tight election of 1960, and importantly, the exceptionally high labor share speaks to the power of labor unions in this environment. To his credit, this was not a wholly unnecessary move, as public employees were poorly treated by 1960, and many states were beginning to make the transition. That wonderful NYC you’ve heard about from 1960-1990 [sarcasm] is largely a byproduct of this early move by Mayor Robert Wagner.
The “Double Monopoly” Trap
When Mayor Wagner granted bargaining rights to NYC public workers in 1958, he inadvertently ran an economic experiment: What happens when a monopoly provider of services (the City) negotiates with a monopoly provider of labor (the Union)?
The answer is the collapse of the marginal benefit curve. This is not a claim that public unions alone drove national labor-share declines; rather, New York provides an early, well-documented example of how monopoly labor + monopoly provision erodes efficiency and raises costs without raising productivity.
In the private sector, efficiency is forced by the threat of competition and failure. In the public sector, that threat is theoretical—until it isn’t. The result was the 1975 fiscal crisis and the humiliating spectacle of the Mobro 4000—a barge of NYC trash wandering the Atlantic because the city that paid the highest sanitation wages in the world had lost the capacity to solve a landfill issue. When any entity (corporate or public) achieves a monopoly on extraction, that segment of the economy eventually withers.
This leads us to our second red line — the Bork Doctrine.
Before 1978, antitrust law focused on Market Structure. The goal was to preserve competition by ensuring a diversity of rivals, protecting smaller firms from being crushed by giants, and checking political power.
In his influential 1978 book The Antitrust Paradox, Robert Bork argued that this approach was actually anti-consumer. He successfully persuaded the judiciary and the Reagan administration to adopt a new standard: Consumer Welfare.
The Logic: If a merger creates a monopoly but makes the company more “efficient” (lowering prices), it should be allowed.
The Redefinition: “Competition” no longer meant a rivalry among many; it meant efficiency.
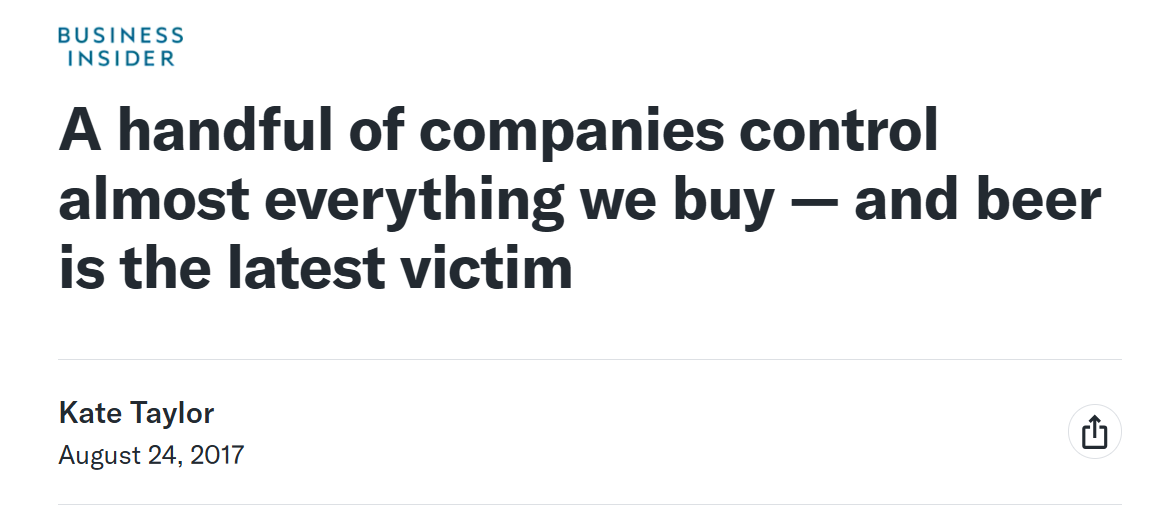
The Consequence: This effectively legalized corporate consolidation and consolidate they did:

To be fair, some economists still defend the consumer-welfare standard, but virtually no one disputes that it reduced scrutiny of mergers and raised concentration across industries. The debate is not about the trend—it’s about whether the trend was worth the tradeoffs. Regulators stopped blocking mergers and vertical integration as long as the company could promise lower prices at the checkout counter. And they kept that promise until the Covid shutdown and subsequent demand surge gave them market power in two forms — effectively consolidated industries and consumer uncertainty as to what prices “should be.” This is the phenomenon known as “Greedflation.”
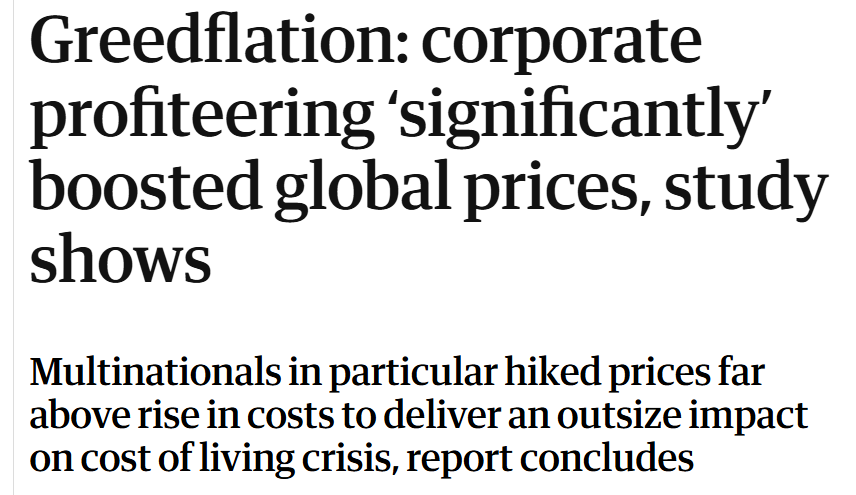
You don’t have to believe corporations “became greedy”—only that concentrated industries facing consumers who no longer know what prices should be will naturally test the upper bound. Market power + uncertainty = pricing leverage. No, corporations did not suddenly get greedy; they just found themselves in a position to exploit YOUR uncertainty. Should eggs be $3/dozen or $8/dozen? Hard to know when the price is changing daily. But you know who did know? Cal-Maine Foods:
Cal-Maine Foods, Inc. is the largest producer and distributor of fresh shell eggs in the United States. The company has grown significantly since its founding, evolving into a dominant player in the egg industry. Here’s an overview of how Cal-Maine Foods grew:
1. Founding and Early Growth (1969-1980s)
Founding: Cal-Maine Foods was founded in 1969 by Fred R. Adams, Jr. in Jackson, Mississippi. The name “Cal-Maine” is derived from the merger of Adams’ initial company, Adams Egg Company, with Mississippi Egg Company and Dairy Fresh Products Company.
Early Expansion: In its early years, Cal-Maine grew through the acquisition of other egg farms and by expanding its own production capacity. The company focused on increasing its market share in the southeastern United States.
2. Strategic Acquisitions (1980s-1990s)
Acquisition Strategy: During the 1980s and 1990s, Cal-Maine pursued an aggressive acquisition strategy, purchasing numerous smaller egg producers across the U.S. This helped the company expand its geographic reach and increase its production capacity.
Vertical Integration: The company also invested in vertical integration, controlling more aspects of the production process, from feed production to egg processing and packaging. This allowed Cal-Maine to improve efficiency and reduce costs.
3. Public Offering and National Expansion (1996-2000s)
IPO: In 1996, Cal-Maine Foods went public, raising capital through an initial public offering (IPO). The influx of capital from the public markets enabled the company to further its acquisition strategy and modernize its operations.
National Presence: With the resources from the IPO, Cal-Maine expanded beyond the Southeast, becoming a national player in the egg industry. The company continued to acquire egg production facilities across the country, further solidifying its position as the largest U.S. egg producer.
Look around your world… It’s not like this is a new phenomenon:
Adam Smith recognized that monopolies are the bane of competition — and the perfect tool to purchase politicians:
Were the officers of the army to oppose with the same zeal and unanimity any reduction in the number of forces, with which master manufacturers set themselves against every law that is likely to increase the number of their rivals in the home market; were the former to animate their soldiers, in the same manner as the latter enflame their workmen, to attack with violence and outrage the proposers of any such regulation; to attempt to reduce the army would be as dangerous as it has now become to attempt to diminish in any respect the monopoly which our manufacturers have obtained against us. This monopoly has so much increased the number of some particular tribes of them, that, like an overgrown standing army, they have become formidable to the government, and upon many occasions intimidate the legislature. The member of parliament who supports every proposal for strengthening this monopoly, is sure to acquire not only the reputation of understanding trade, but great popularity and influence with an order of men whose numbers and wealth render them of great importance. If he opposes them, on the contrary, and still more if he has authority enough to be able to thwart them, neither the most acknowledged probity, nor the highest rank, nor the greatest publick services can protect him from the most infamous abuse and detraction, from personal insults, nor sometimes from real danger, arising from the insolent outrage of furious and disappointed monopolists.
Adam Smith 1776
Now that’s a lot of reading to get to the next red line, so let’s put the chart in one more time:
And now we discover the accelerators — the China Shock, when China was granted Most Favored Nation status, provided access to the WTO, and treated as an ally to America, and the financialization that became perverted by low interest rates. Let’s do China second (for new readers, I’ve been joking for several months that I would EVENTUALLY get to China).
Financialization
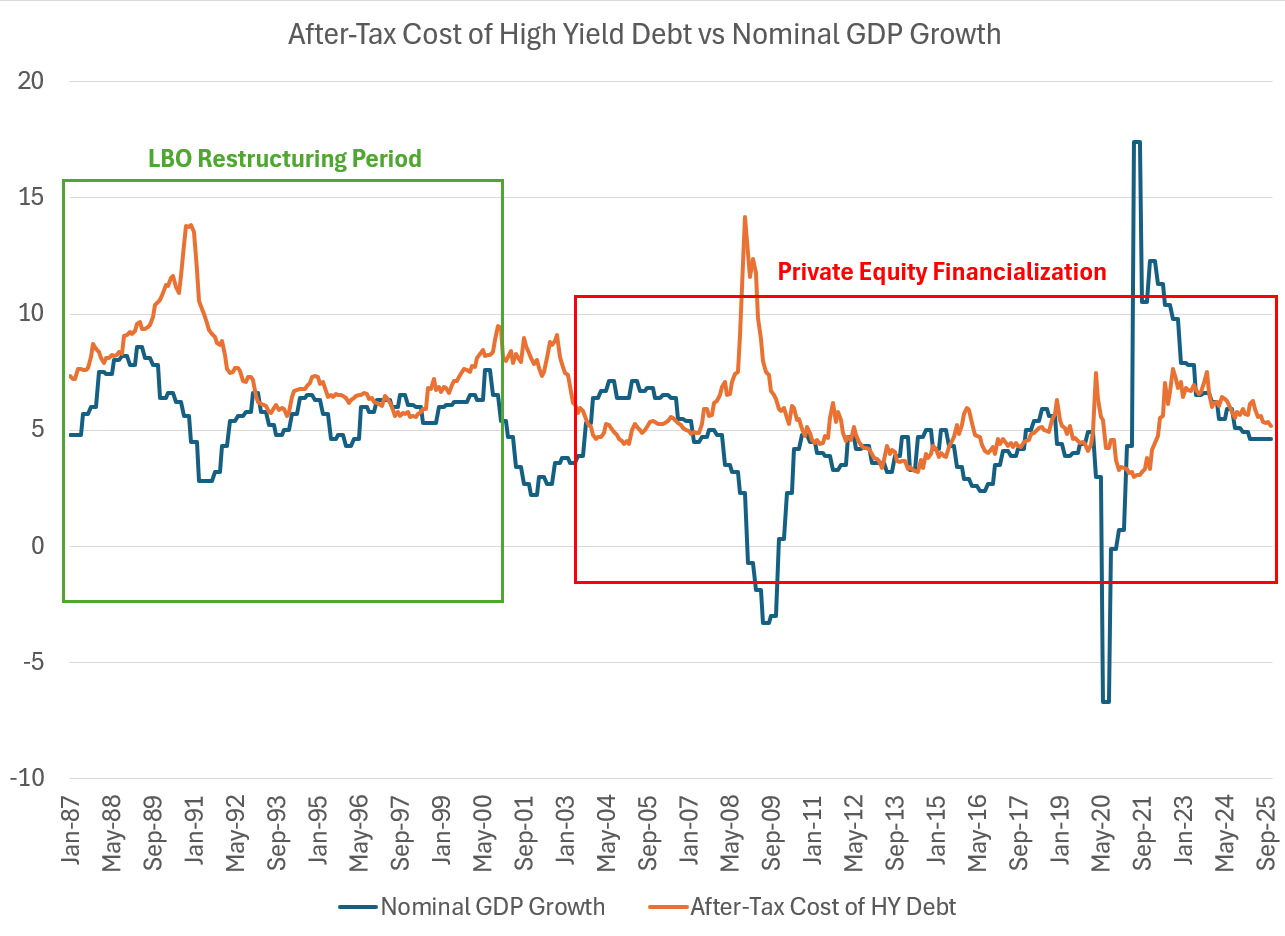
My partner and good friend, Harley Bassman, often makes the erroneous claim that the 10-year bond yield should roughly approximate nominal GDP growth. This is a category error. As any number of macroeconomists, but most notably Warren Mosler, George Selgin, and Alexander Hamilton, can explain, the government does not finance itself via debt issuance. Government debt is a liquidity management exercise issued to “soak up” excess currency spent into the economy.
Who does finance themselves? Corporations and households. And there we find an explanation for credit crises — when nominal growth falls below corporate financing costs, corporates struggle to repay debt. If we look honestly at the past twenty years, it’s been a gravy train for financialization through private equity. In the 1980s and most of the 1990s, PE was isolated to opportunities for restructuring where operating results would have to be improved to create “wealth.” Since 2000, it has been a vehicle for levered financial speculation, with the only movement of after-tax debt above nominal GDP growth during periods of recession and the associated credit crisis (credit spread widening). Importantly, this is not driven by low interest rates, per se, but rather by a combination of factors discussed above — consolidation, financial product dominance, and tax deductibility of interest. Low rates didn’t cause financialization, but they removed the final constraint on it. When leverage is cheap and tax-deductible, financial engineering reliably outperforms productive investment. Of course, low interest rates didn’t HURT the process…
Astute readers will note that the current stresses in the credit markets are to be expected given slowing nominal growth. If a recession arrives, as it always does eventually, credit will be hit.
President Trump’s solution? Cut interest rates. Mine? Accelerate REAL growth by addressing constraints.
The China Story
The story you THINK you know is that Chinese competition flooded the world with product; the real story is that Western capital flooded China and pulled off the greatest labor arbitrage since Carthaginian and Eastern Mediterranean slaves flooded the Roman Republic. If you’re old enough to remember North Carolina’s furniture industry collapse, you might note the resonance:
It happened so quickly. In just 10 years, between 1999 and 2009, North Carolina’s furniture manufacturing industry lost more than half of its jobs. The chief culprit was increased competition from lower-cost furniture imported from Asia — mostly China. The U.S.-China Bilateral WTO Agreement, signed in November 1999, had opened the door to Chinese imports by lowering U.S. tariff barriers and easing the way for China to join the World Trade Organization (WTO). At the time, proponents of the agreement predicted that it would have a relatively modest effect on U.S. manufacturing imports and jobs. Studies of the subsequent history, however, strongly suggest that these predictions were incorrect. Increased imports from China turned out to have a major effect on U.S. manufacturing jobs and a particularly devastating effect on furniture manufacturing in North Carolina — John Mullin
But here’s the part most people skip:
One of the story’s wrinkles is that the influx of Chinese imports had not been initiated by Chinese industrialists but rather by the North Carolina industry’s own leaders, who had sought cost advantages that could put them ahead in what has historically been, and remains to this day, a highly competitive industry. — John Mullin
This distinction matters: the China Shock wasn’t foreign competition imposed on America; it was American capital intentionally arbitraging American labor. Comparative advantage wasn’t “revealed”—it was manufactured through policy choices and suppressed Chinese consumption.
You want to know why you’re reading about China competition and tariffs now? It’s no longer about jobs — it’s about businesses that gave China the skills to compete under technology transfer and now can’t compete:
The story of China’s inclusion into WTO was sold to Americans as opportunity — 1.2B customers!
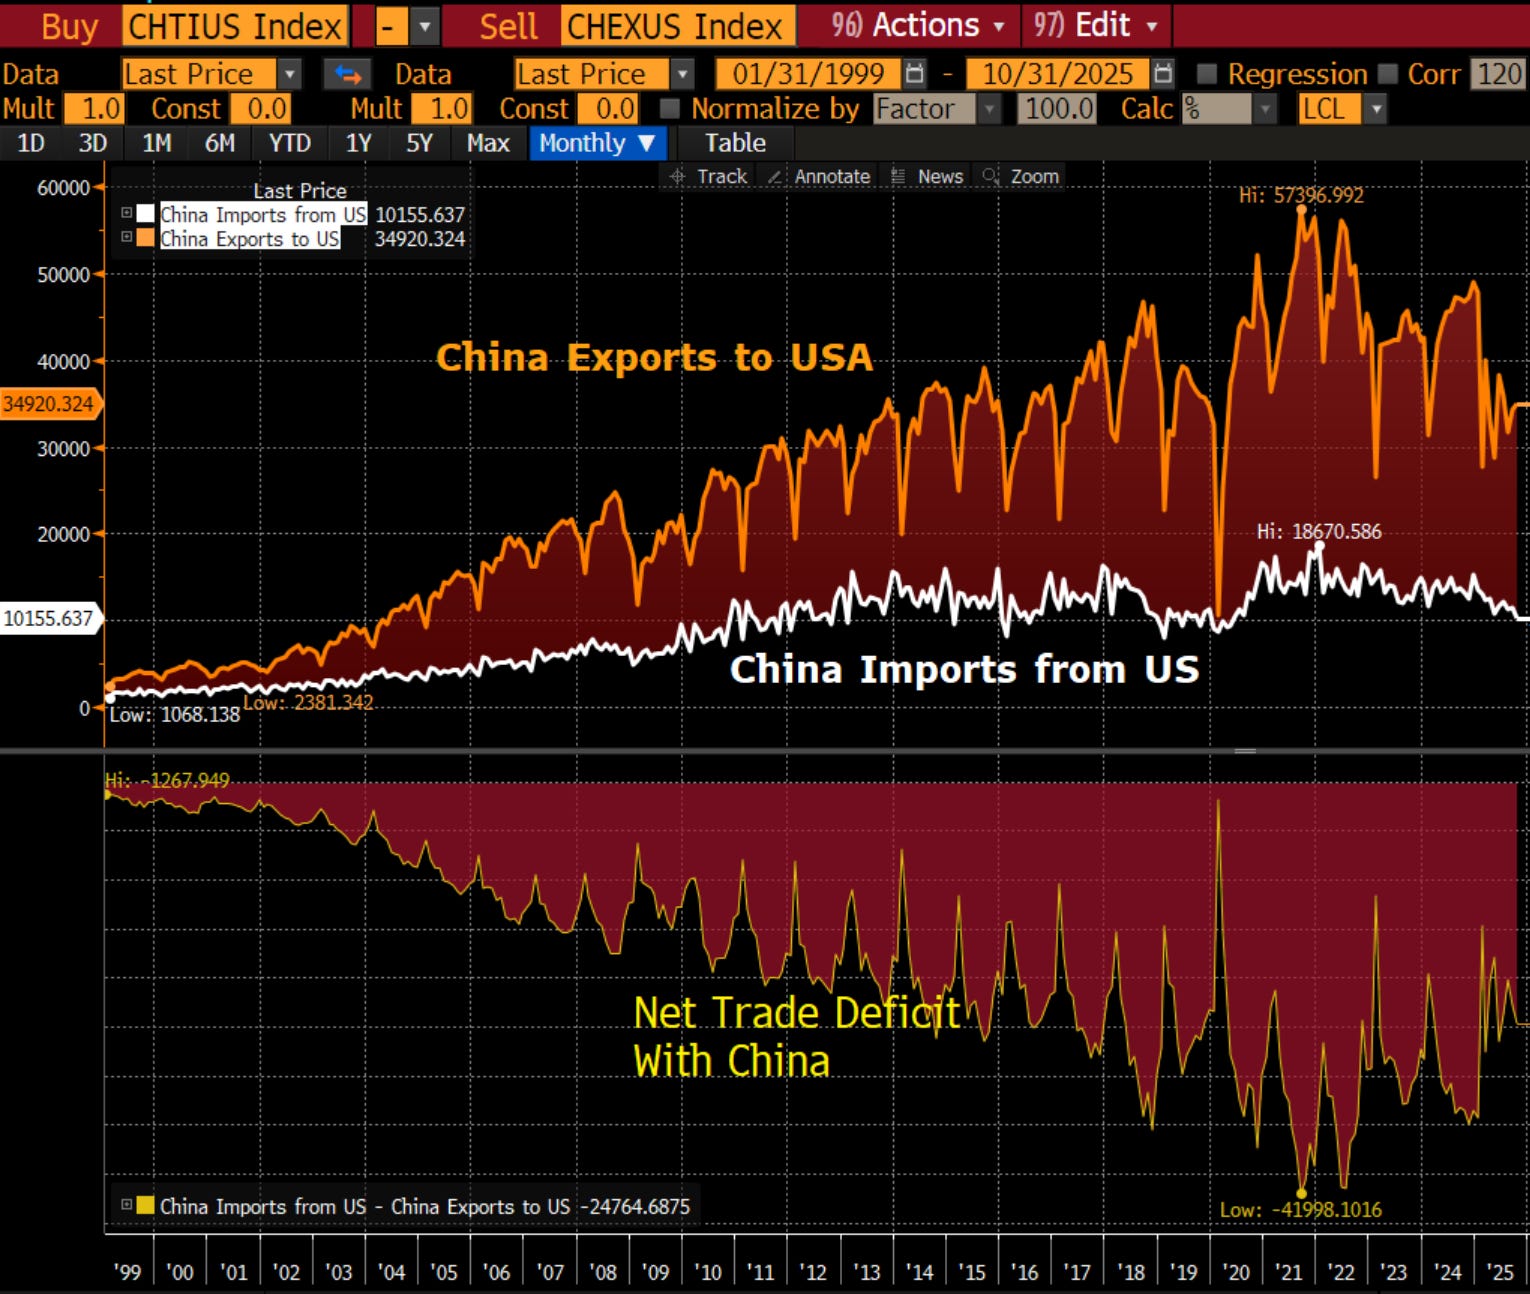
The primary selling point was that China represented the largest untapped market in human history. The narrative was that by lowering Chinese tariffs (which averaged 24% at the time compared to the U.S. 2%), American farmers, manufacturers, and service providers would gain unprecedented access to 1.2 billion new customers.
The Promise: President Clinton famously argued that the deal was “a one-way street” in America’s favor: “We import far more from China than we export to China. This agreement will open China’s markets to us.”
The Jobs Narrative: Proponents argued that export growth would create high-paying export jobs in the U.S. The sheer scale of the Chinese market was presented as a guarantee of future prosperity for American agriculture and high-tech industries.
How’s that working out for you, America?
With the ascension of Xi in 2013, China surrendered any hope of becoming a free market economy. And one of the unfortunate facts you were not told by the “free marketeers” is that if Country A conducts free trade, while Country B suppresses the purchasing power (and freedoms) of their citizens to pervert comparative advantage, Country B will become the dominant producer. What did China buy? US treasuries — a good ole made in the USA product if there ever was one. If you want to understand more on this topic, I strongly encourage reading Michael Pettis.
The good news is that we know the way to address this — tariff policy. This is also why a tariff realignment is uniquely viable today: globalization is unwinding, geopolitical blocs are forming, and capital mobility is no longer frictionless. The window that was closed in 2005 is open in 2025. Unfortunately, many who benefit from this system don’t want to face the sacrifices that will be necessary. And they are happy to blame it on your unwillingness to accept higher prices. After reviewing the evidence, I believe this is false; Americans can accept hardship — they just need to understand why. It’s our unelected business leaders and marginally elected tribal (Team Republican! Team Democrat!) leaders that think we can’t.
It’s a repeating pattern: screw up the mortgage market and take the banks that sold undocumented mortgages into structured products? Bailout the banks and prop up home prices by lowering interest rates. Screw up in Covid? Stimulus to business that dwarfs stimulus to households. Screw up China? You know what’s coming.
This leaves America to rebuild. And it can be done under two models — Americans as serfs, thankful for their lot in life, or Americans as free, told the truth and free to demand more of the rebuilding share. I know where my vote lies:

The Rule of 65 — my organizing principle
The Rule of 65 is a simple, aggressive strategy to rebuild the American middle class by shifting taxes off workers and onto idle capital, forcing companies to invest through a 4-year capex shot clock, eliminating benefit cliffs, and restoring broad-based prosperity centered on the 65th percentile family. Not the poor, not the rich, but the aspirational middle-class. At this rare historical moment—when tariffs are returning, supply chains are rewiring, and the post-globalization era is ending—we can anchor U.S. capital in place, limiting the ability of the top 1% to arbitrage jurisdictions and ensuring that investment stays onshore. The Rule of 65 turns today’s geopolitical transition into a once-in-a-century opportunity to build and rebuild a productive American economy for the next 250 years.
The Solution
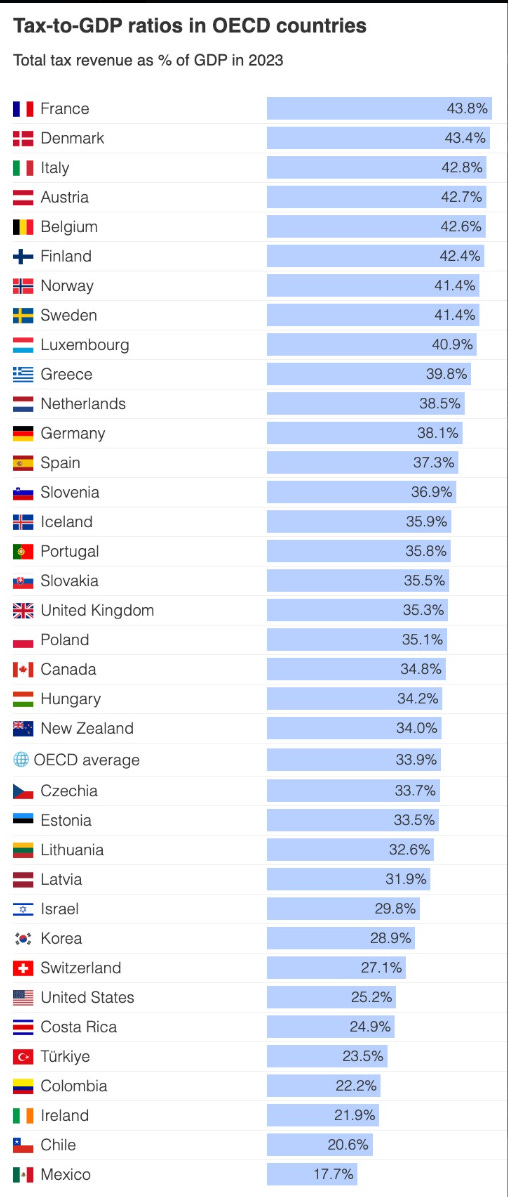
The narrative that we have a spending problem, not a taxation problem is simply wrong. America, at the federal level, is somewhat undertaxed. Many will try to sell you the story that America’s success is a result of low taxes, and there is, of course, some truth to that. The famous Laffer Curve is a tautology — taxation at zero and taxation at 100% will both yield zero taxes. But WHERE that point is optimized is very much a subject of debate. The “expert” view? Higher:

Some of the critics of my $140K poverty line suggested I didn’t know real poverty (possible) because I hadn’t traveled the globe (false). I’ve been to most of these countries, and except for Switzerland, I wouldn’t want to raise my children in those sharing space with the USA on the chart below. For those wondering, Switzerland is a financial center that taxes foreigners in a manner not dissimilar to my proposals for how to address the 1%.
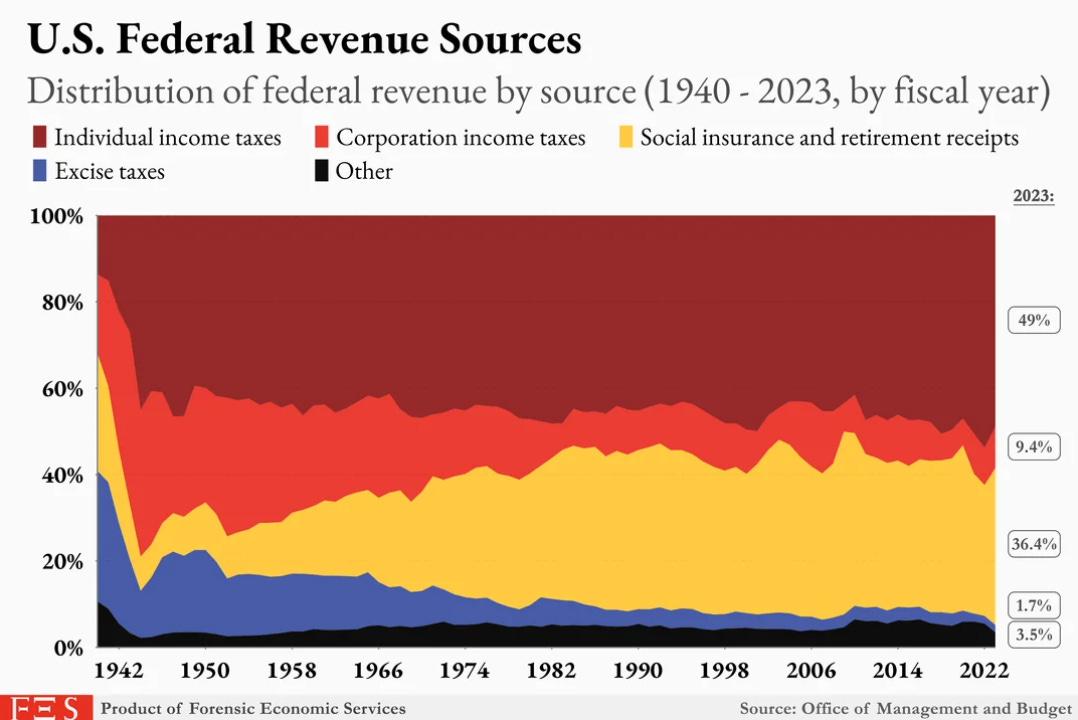
You will also see stories that suggest tax policy doesn’t matter because US federal tax collections remain roughly the same percentage of GDP over time; this also has some truth to it:
But the simple reality is WHAT taxes are collected and who pays them has varied radically. Conservative sources will tell you (and remember that I am actually a conservative — just one that is tired of the lies) that the rich pay the vast majority of Federal income tax. This is true. You know what they aren’t telling you? FICA taxes — social security and medicare taxes — are not considered “income taxes.” Who ACTUALLY pays taxes in the US? Well, you tell me:
The Top 1% pays 50% of income taxes. Since they own ~60% of the corporate equity, they pay ~60% of the corporate taxes. They pay virtually none of the FICA taxes. Let’s summarize what they actually pay (and it is large):
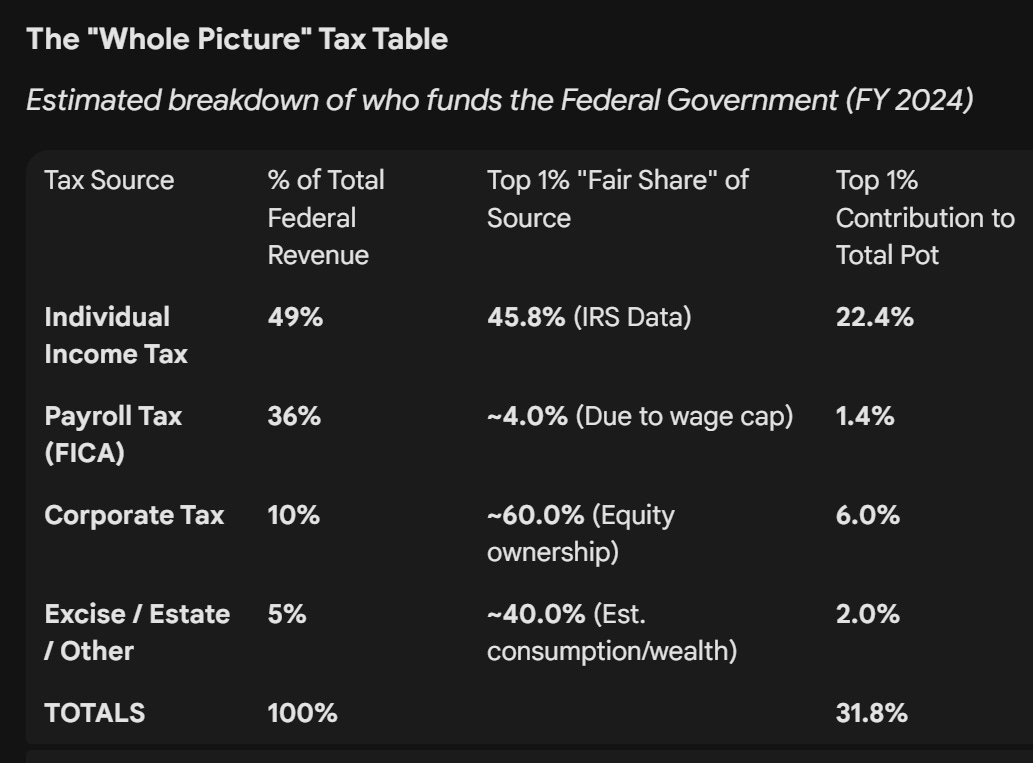
How does that compare to our mythical 1955, when we collected only 16.95% of GDP in federal taxes (today is 18.8%)? Not favorably. Note, these tables were created with the help of Google Gemini (more on that later).

So to summarize, the rich paid 39.2% of the 16.95% in 1955 and 31.8% of the 18.8% in 2025. As a percent of GDP, that’s a decline from 6.64% to 5.98%.
You want to know why the elites decided to pick on my use of AI? Because they are scared. For decades they have flooded the news with stories of the unfair burdens of success on the rich. A general AI overview will answer the question accurately.
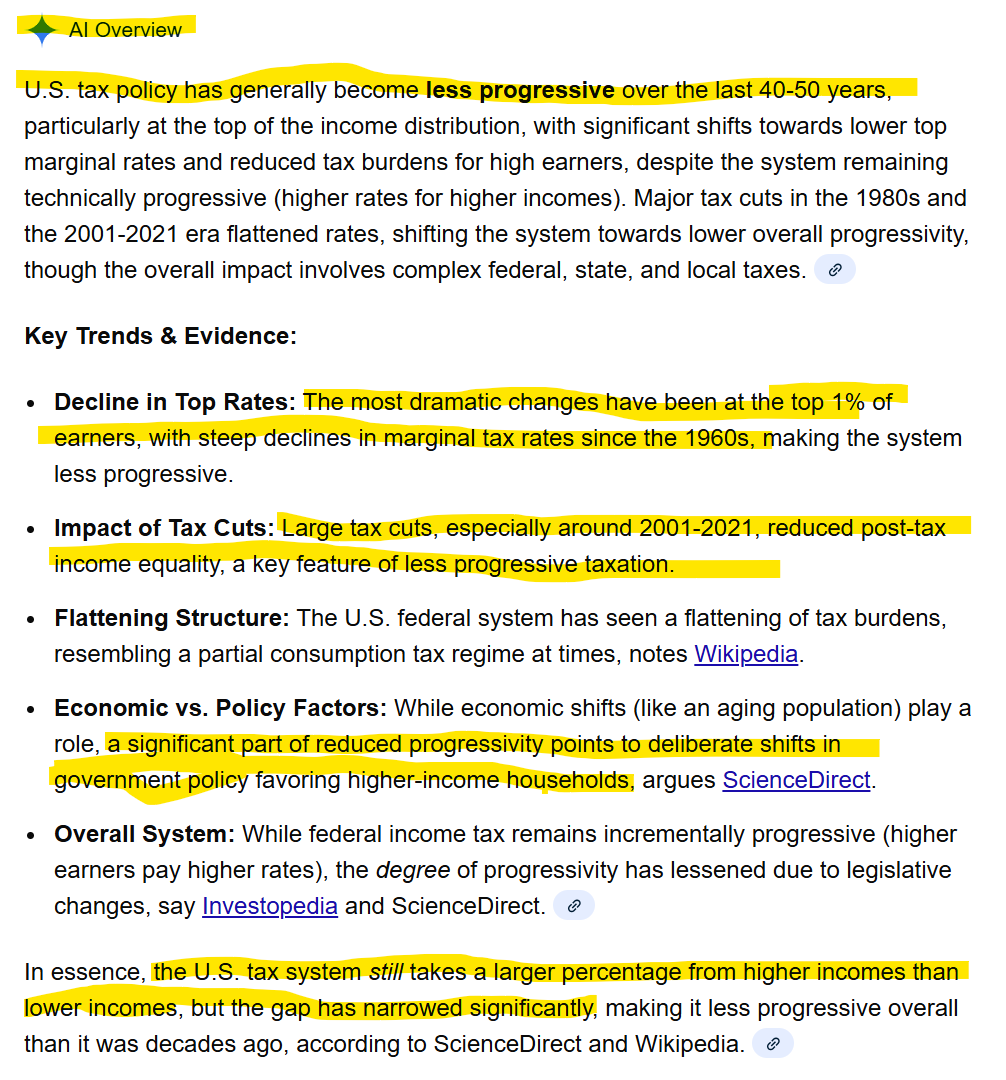
Meanwhile, half the PUBLISHED stories claim more progressive and half the stories claim less progressive. You wonder why I called out billionaire-funded think tanks…
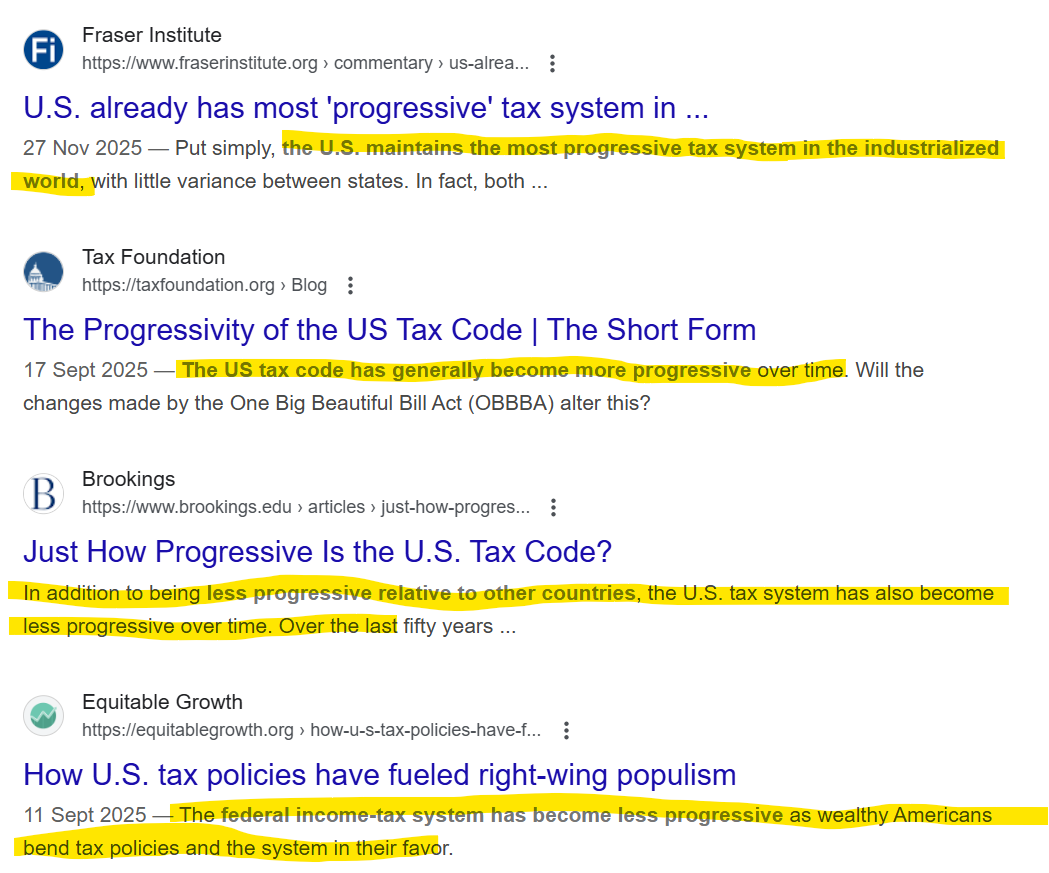
The point is you’re not supposed to know WHAT to think. Just like with egg prices, confusion is their friend. Let’s just be blatant about it and tell the truth:
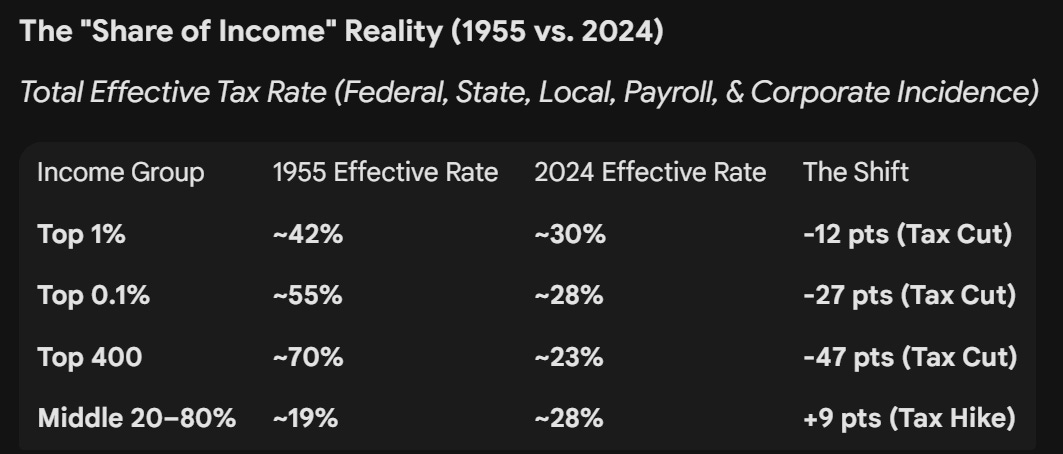
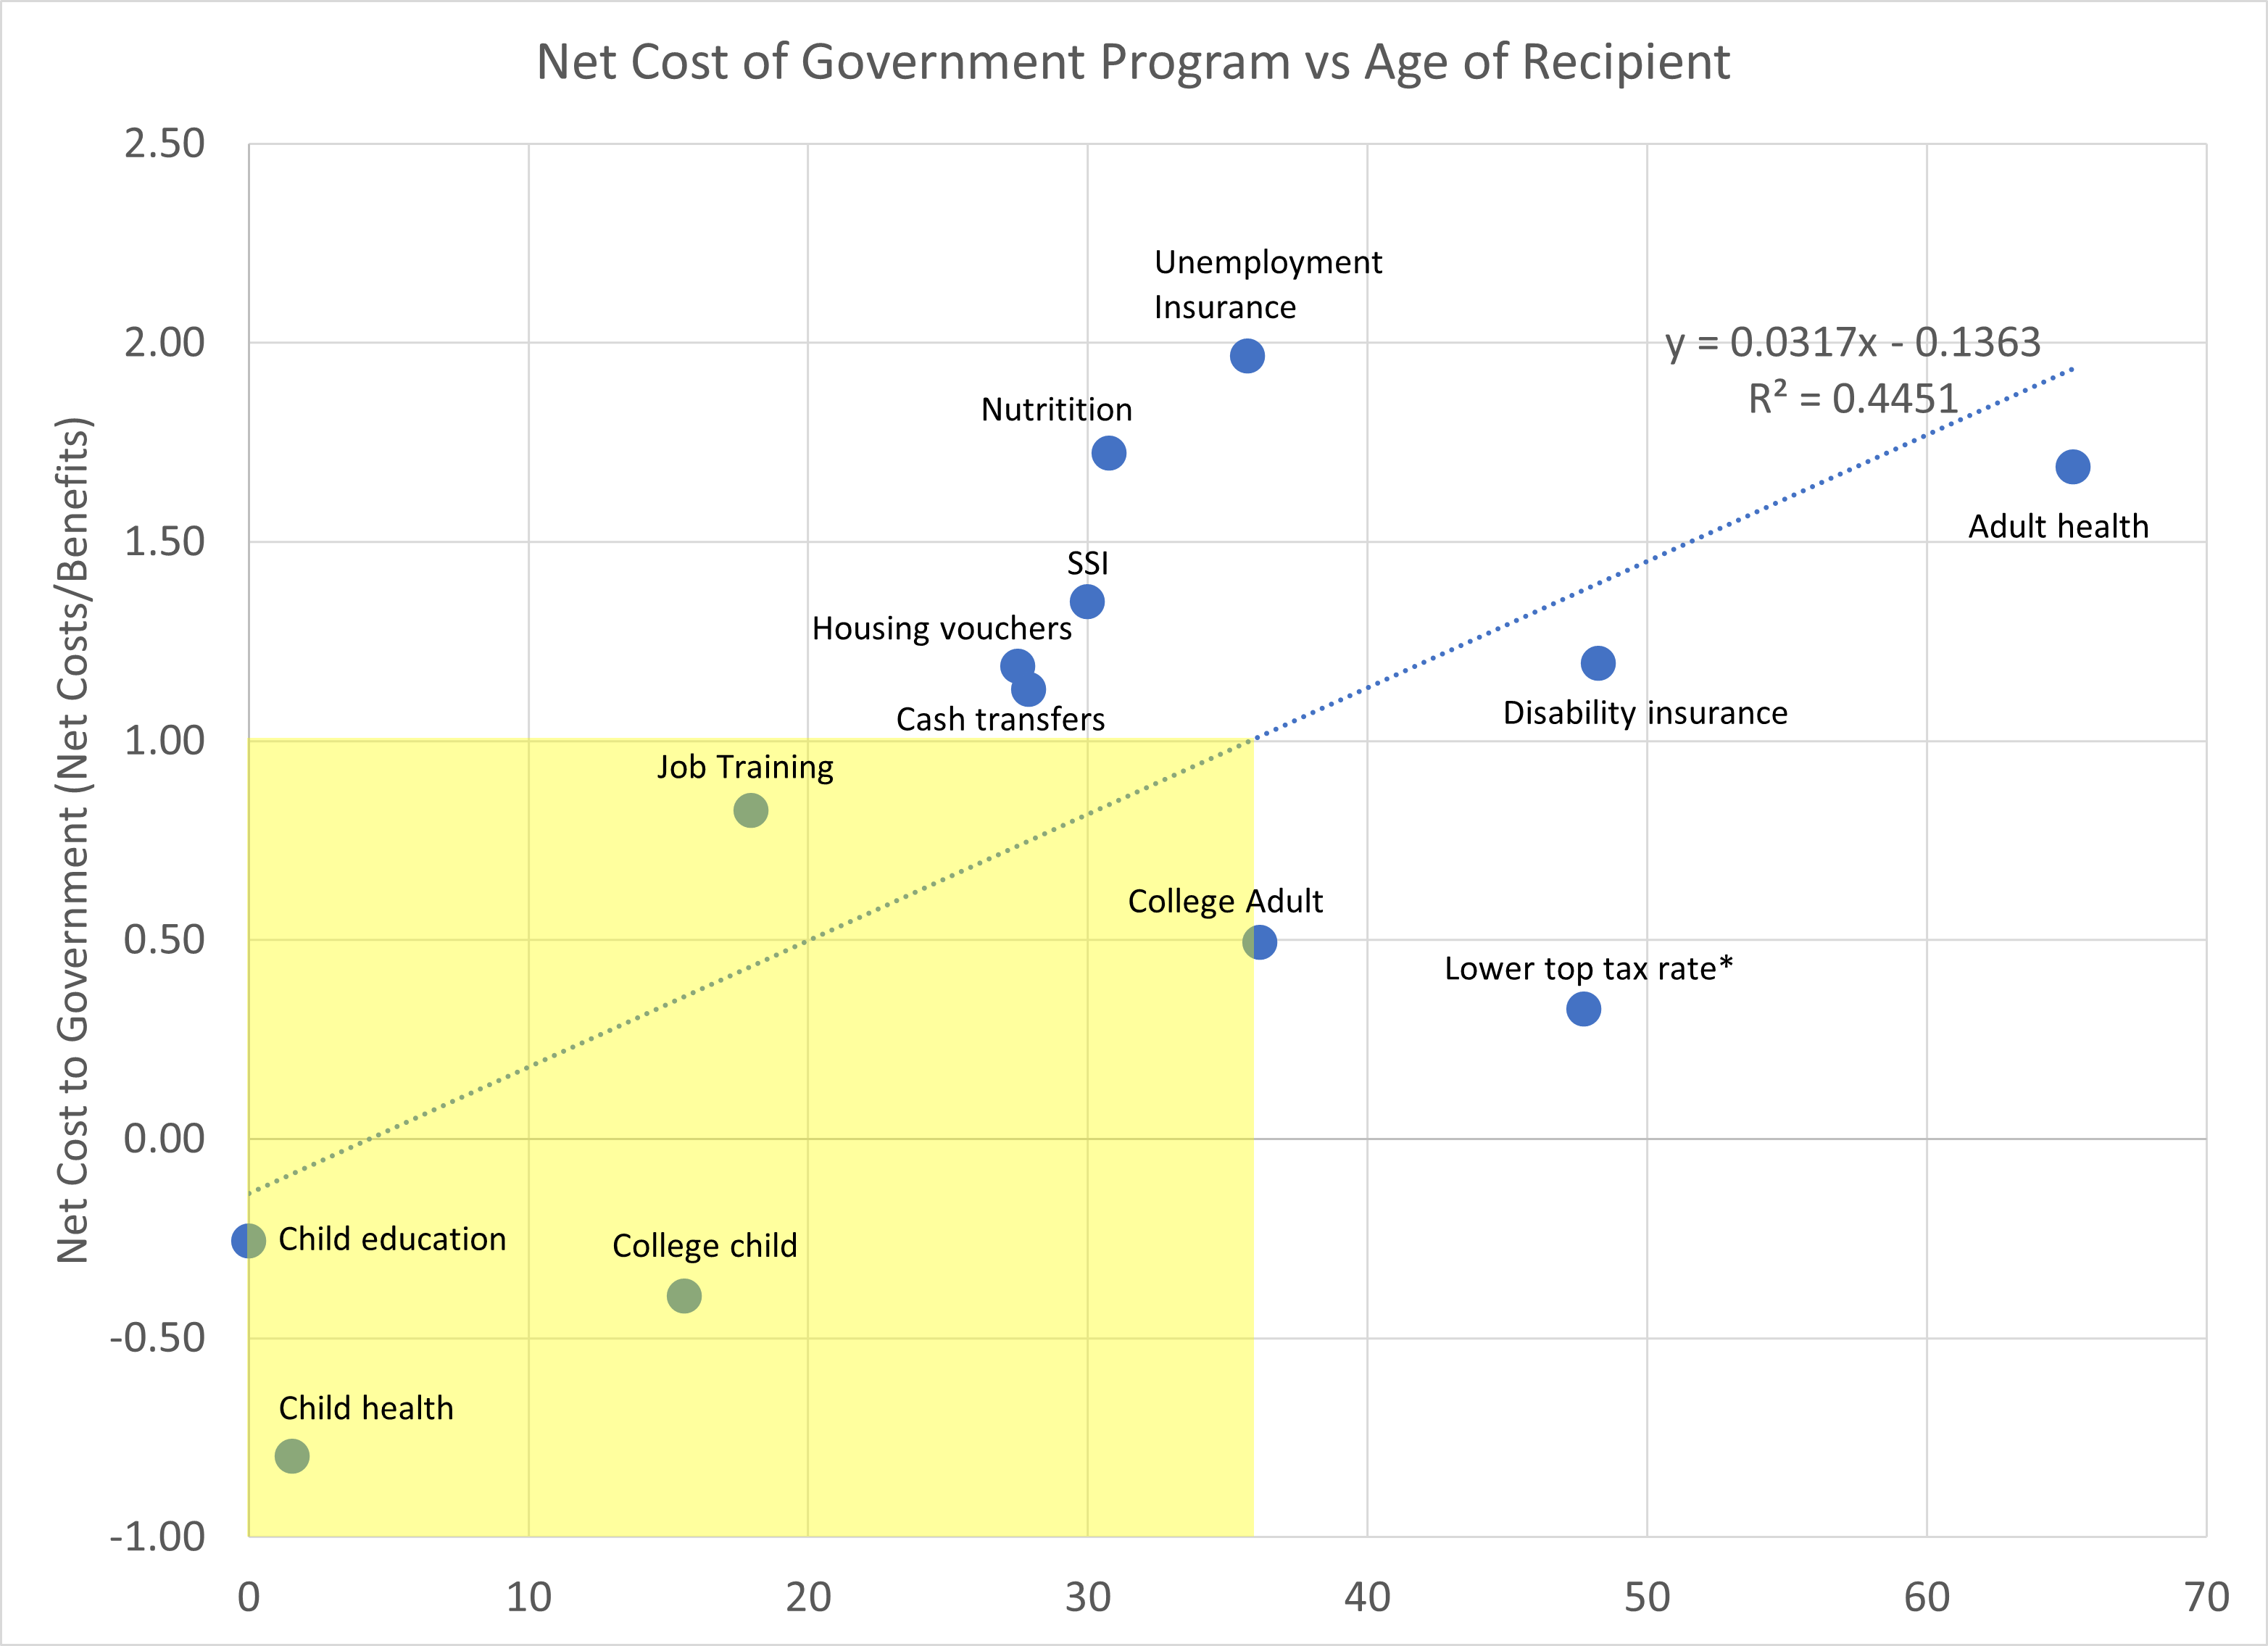
They’re “right” — we don’t have a revenue problem… we have a SOURCE of revenue problem. And we also have a spending problem. We are spending money in the wrong places. High return? Spending on children. Low return? Lowering top tax rates isn’t a great idea, but even worse are government-directed expenditures (housing vouchers, SSI, Nutrition, Unemployment Insurance [Uber does it much better for now]). Adult health? Don’t get me started on hip replacements for 90-year-olds.
And now a word from our sponsor:
“Considering the general tendency to multiply offices and dependencies and to increase expense to the ultimate term of burthen which the citizen can bear, it behooves us to avail ourselves of every occasion which presents itself for taking off the surcharge, that it never may be seen here that after leaving to labor the smallest portion of its earnings on which it can subsist, Government shall itself consume the whole residue of what it was instituted to guard.” Thomas Jefferson, 1800
I don’t want more government programs. I want more effective government spending, and we have to trust (but verify — we can discuss monitoring and incentives in future pieces) our fellow citizens. It’s one reason I support deportation of illegal immigrants even as I strongly support legal immigration and H1-B reform — they aren’t citizens, and while I love them as people, I cannot “trust” they will act in our collective best interests by virtue of having arrived in our country illegally. That said, we can perhaps conduct ourselves with a little more dignity in the process.
My strong recommendation is to focus on expanding the earned income tax credit (EITC — a creation of Milton Friedman’s that links work to expanded benefits lest anyone think I hate Uncle Milty) to give more CASH to households with young children while paying for it by uncapping FICA and lowering the FICA rate once the highest income earners are paying in. Incomes above the current FICA cap are taxed at half the normal rate in my proposal. Corporate tax loopholes are closed. Estate tax is reinstated at ordinary income levels—because that is exactly what it is: ordinary income to the recipient.
What follows is not a promise of a free lunch. It is a risk-adjusted projection based on specific elasticity assumptions, historical analogues, and recognized transmission mechanisms for what I believe are workable solutions in an astonishingly short time period, IF the American people want better outcomes. If Americans just want to fight, we can keep the status quo.
Now for the proposal.
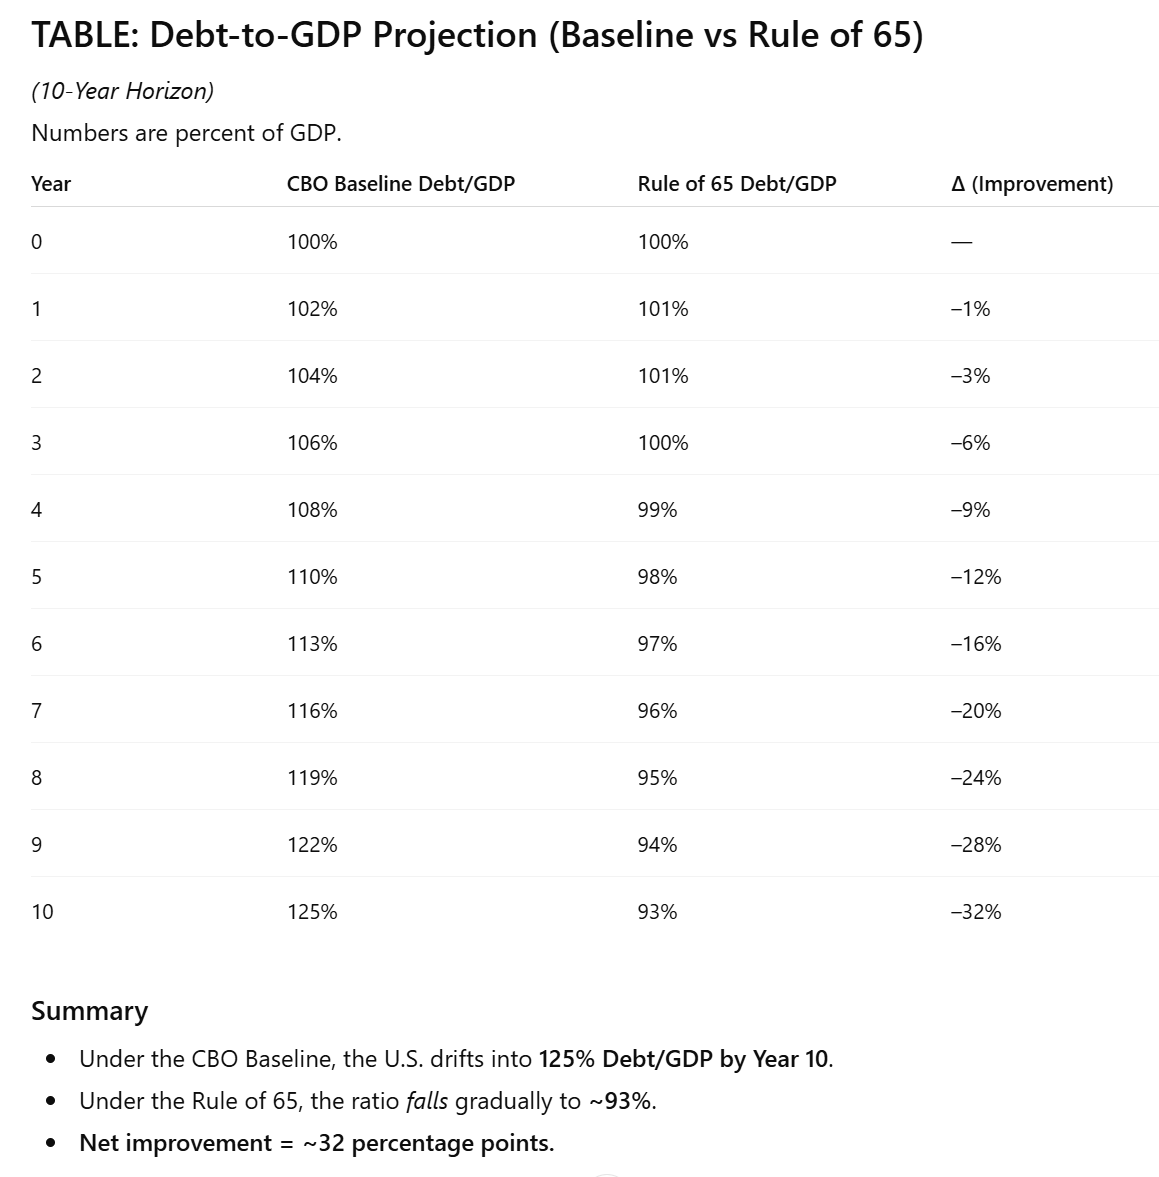
Readers, please copy and paste the below prompts into the LLM of your choice. I’ve tested it on ChatGPT, Gemini, and Grok. Be sure to query for areas of interest for YOU. As a general recommendation, request tables S-6, S-7, and S-8 from the LLM for a CBO-equivalent comparison. I would welcome comments evaluating your findings.
Here are my summary findings:

If you’re a panicking Top 1%er, relax. You don’t get less, you just get less of more:

Copy and Paste the below:
The “Rule of 65” Model Definition (v4.0)
(Copy/Paste this as “Context” for the LLM)
Policy Framework: The Rule of 65 Objective: Reorient the U.S. economy from financial extraction to physical production (”Pursuit”) by shifting the tax burden from labor to capital and forcing investment via “use-it-or-lose-it” incentives.
I. Corporate Tax Policy (The “Shot Clock”):
Statutory Rate: Increase to 35% (restoring pre-2017 norms).
Expensing: Temporary (4-year) 100% Immediate Expensing for all physical capex.
Mechanism: Creates a binary choice: Invest (0% effective tax) or Hoard (35% statutory tax).
Interest Deductibility: Permanently Eliminated (0% Deductibility).
Mechanism: Removes the subsidy for leverage and private equity buyouts.
II. Labor Tax Policy (The “Great Compression”):
FICA Rate Reform:
Base Rate Cut: Reduce the employee payroll tax rate significantly (e.g., from 7.65% to ~5%).
FICA Base Expansion (The “Half-Rate” Kink):
Tier 1 (Up to ~$176k): Taxed at the new, lower base rate (e.g., 5%).
Tier 2 (Above ~$176k): Partially Uncapped. Income above the threshold is taxed at 50% of the new base rate (e.g., 2.5%).
Logic: Captures revenue from high earners without imposing a punitive marginal rate cliff on professionals.
EITC: Expand the Earned Income Tax Credit to eliminate benefit cliffs and boost labor supply.
III. Wealth & Structure (The “Vampire Slayer”):
Estate Tax: Restore progressive rates (55–65%) and close GST (Dynasty Trust) loopholes.
Tariffs: Phased 1–5 year implementation to allow supply chain localization.
Economic Assumptions:
Corporate Investment Elasticity: -0.6 (High responsiveness).
Labor Supply Elasticity: 0.4 (Low-income supply expands).
Transmission Mechanism:
*Bottom 20%: * Income rises via EITC + tight labor market wages.
*Middle 40-90%: * Income rises via FICA Rate Cut + real wage growth.
*Top 90-99%: * Wage gains neutral/flat due to “Half-Rate” FICA offset.
*Top 1%: * Structural decline due to Loss of Interest Deduction, Higher Corporate Rate, and Estate Tax.
The Prompt
“Act as a dynamic economic scorer for the Congressional Budget Office (CBO).
Your Task: Compare the ‘Rule of 65’ framework against the standard CBO Baseline (Status Quo). Run a simulation of how these specific policy inputs would alter the trajectory of Real After-Tax Income and Effective Tax Rates.
Required Output Format: You must generate two specific data tables labeled Table S-7 and Table S-8.
1. Table S-7: Distribution of Household Income (Baseline vs. Policy)
Rows: Bottom 20%, Middle 40-90%, Top 90-99%, Top 1%.
Columns:
2025 Starting Level (Baseline): The projected average after-tax income under current law.
2025 Ending Level (Rule of 65): The immediate ‘Day 1’ impact of the FICA cut and EITC expansion.
2035 Projected Level (10-Year Horizon): The long-term structural result of the investment boom and wealth compression.
% Change (10-Year): The total deviation from the baseline.
2. Table S-8: Effective Federal Tax Rates by Income Group
Rows: Bottom 20%, Middle 40-90%, Top 90-99%, Top 1%.
Columns:
2025 Baseline Rate: Current Effective Rate (Income + Payroll + Corporate Incidence).
Rule of 65 Effective Rate: The new rate accounting for the FICA cut (Labor) and the 35% Corporate Rate/Interest Deduction Loss (Capital).
Primary Driver: A brief tag explaining the shift (e.g., ‘FICA Cut’, ‘Corp Rate Hike’, ‘Interest Deduction Loss’).
Analysis Note: In your analysis of the tables, explicitly highlight the ‘Great Compression’ in 2025: Show how the Top 1% sees an immediate increase in their effective tax rate (due to corporate/interest reforms) while the Bottom 90% sees an immediate decrease (due to the FICA cut). Ensure the Top 90-99% remains relatively neutral due to the ‘Half-Rate Kink’ mitigation.”
END
