Billions and Billions Served
Cracks are showing in the service economy that has powered the last 100 years (Part 1) and alongside bank credit contraction (Part 2) it holds clues to what to expect when everyone is expecting
As a reminder, we’ll be going to a paid service on June 1st. We’ve decided on $99/year or $10/month with a 50% discount for Simplify customers. Several have requested “scholarships.” These are granted without question (please email me at yesigiveafig@regmanagement.net to request one); if you find the content valuable and can pay, please do so. Regardless, thank you for reading!
Note that we have introduced a Summary section which will remain above the paid subscriber line.
Summary:
The US economy has undergone a significant shift towards a services-driven economy over the years. However, there has been a recent downshift in services consumption per capita growth, even before the pandemic. This downshift is similar to the decline observed from 1907 to the end of World War II.
While the current manual/domestic labor shortage may have short-term bullish implications for household workers, there are concerns about the long-term effects.
The data on wage growth from the Atlanta Fed Wage Tracker is lagging and biased towards lower-wage workers, which may not accurately capture the current labor market conditions.
Concerns about inflation are also raised, with evidence suggesting a decline in real-time metrics and a potential for deflation.
The decline in bank credit, both in nominal and real terms, is an unprecedented event without a significant recession.
One of the well-known facts about the US economy is “it’s a services-driven economy!” But we rarely consider how this came to be, how that changes our perception of historical growth patterns, and how this may help to inform our view of the future. And this matters quite a bit, for the pattern is changing and changing rapidly.
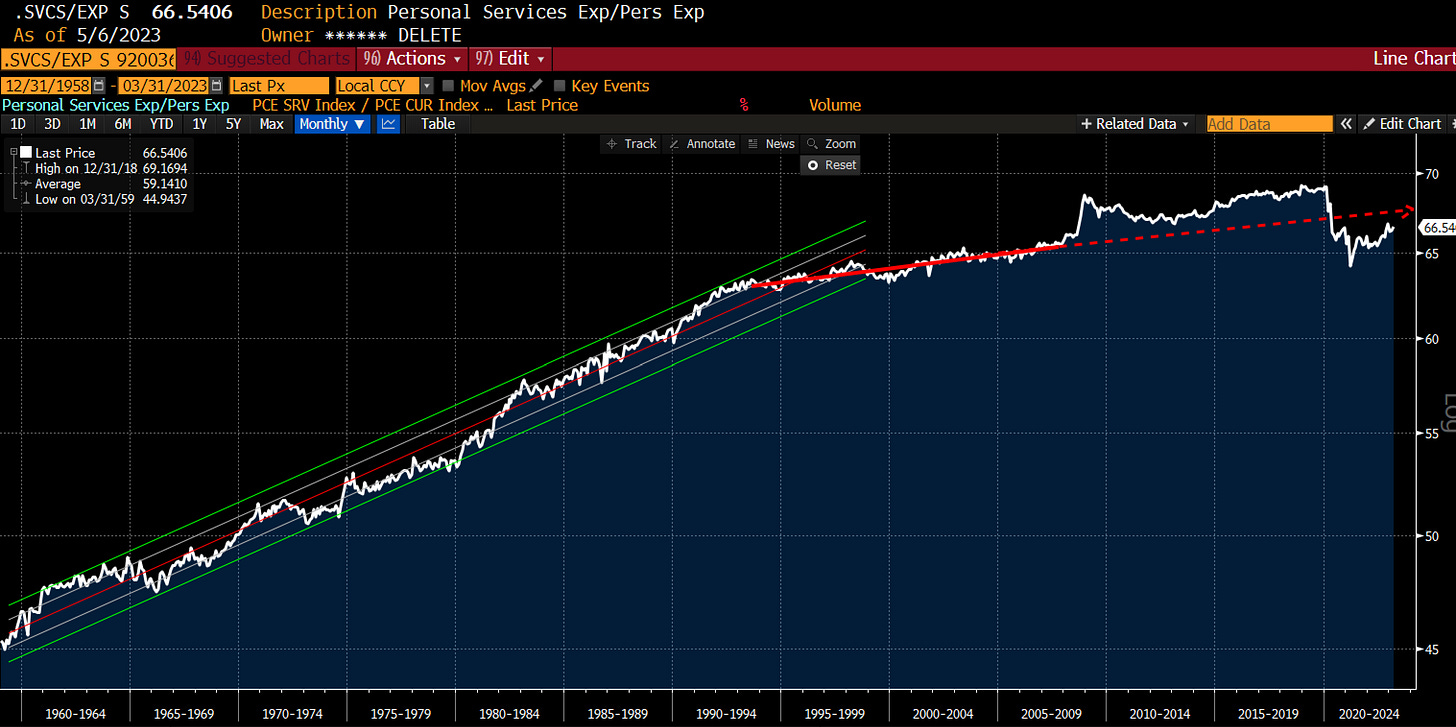
As the chart below highlights, as recently as 1970, less than half of personal consumption expenditures were tied to services. But while services have continued to grow as a share of GDP and personal consumption expenditures, a remarkable downshift occurred with the 1990 recession that has slowed the rate of gain from about 5% per decade to less than 1% per decade as of 2019. Today, it’s rising less than 0.1% per decade.
Thanks to Our World in Data and the work of academic Berthold Herrendon, we can extend this dataset further back for the United States and look at per capita growth in GDP by sector — services vs non-services (goods and agriculture). Tracing the data back to 1839, it’s pretty remarkable that nearly ALL of GDP growth in the United States has been a function of population growth and services per capita growth:
Graphically, it looks even more striking:
Unfortunately, over the last decade, a remarkable downshift in the growth of the quantity of services consumed per capita has occurred — even before the pandemic. This downshift has few parallels; unfortunately, the most obvious is the decline from roughly 1907 until the end of WW2. This has occurred at the same time that the quantity of goods per capita has grown:
The 1907-post-WW2 period is well documented as the first transition of women from “mistresses and maids” as the increased levels of urbanization that accompanied the final push to the Western frontier and the increased investment in female education (discussed in prior episodes of YAGIF) led to a dramatic decline in the number of households with “maids.”
As discussed in Phyllis Palmer’s 1989 classic, Domesticity and Dirt: Housewives and Domestic Servants 1920-1945, the true story of the Great Depression is the collapse in households with servants as both technologies emerged to reduce the need for these servants and the costs of running a household relative to incomes rose rapidly:
And we can see this in the data — the absolute number of domestic workers in the United States peaked in 1950, but the fraction of the labor force involved in domestic work peaked in 1870! Throughout the 1920-1945 period, the proportion of the labor force engaged in domestic work fell from just over 6% to around 4% by 1950. It never looked back:
Palmer notes, however, that this approach is misleading as dividing the number of workers into households ignores the potential for a worker to service multiple households. And this is precisely what we saw as the introduction of inexpensive power appliances radically changed the time required to do the physical labor necessary to keep a home clean (versus “tidying,” which is a never-ending chore). This productivity gain manifested in a reasonably stable level of “some” household help over the 1950-2000 period:
The power vacuum in 1925
The first electric washing machine for the home in 1923. “Perfected” with the GE top loading washer in 1947.
The electric clothes dryer in 1937
The electric steam iron in 1952
These gains in efficiency translated to far greater usage of “household help” than the historical record might suggest. Again from Phyllis Palmer:
If the poorest households are excluded from the statistics, the percentage of homes with service increases dramatically, as indicated by 1930–1931 studies of urban, college-educated homemakers, or middle-class families, from 20 to 25 percent of which had a servant.23 Studies of members of the American Association of University Women (AAUW) and of self-described career women–homemakers published in the late 1920s concluded that two-thirds of the AAUW working wives and 90 percent of the career women who combined marriage, motherhood, and professions had some domestic help (and half the AAUW set had full-time help24). A 1937 survey for Fortune magazine reported that “70 percent of the rich, 42 percent of the upper middle class, 14 percent of the lower middle class, and 6 percent of the poor reported hiring some help.”
However, by 2018, i.e., PRE-pandemic, The Atlantic was writing articles about the changing character of household help:
So when we talk about “labor shortage,” the most obvious conclusion is that “good (household) help is hard to find.” The challenges are everywhere!
The unaffordability of household help is a key contributor to changing household behaviors. For the first time in recent memory, other than the Global Financial Crisis, home sizes are shrinking:
One way to interpret the decline in services growth is that Americans are just itching to ramp up their services spend. However, the decline in services growth is matched by an unexpected rise in GOODS. Why? For the same reason we saw in the 1920-1950s period — “services” are being productized. “Vacuuming” as a service offered by household help is being replaced by robotic vacuums. As usual, the news gets the story wrong. It’s not that the “rise of smart homes and the internet of things” is leading to rising demand for robotic vacuums. It’s that the rising cost of household help is increasing demand for PRODUCTS that reduce the need for it:
The National Association of Realtors is even writing on the subject:
This is not simply a domestic story. Check out the commercial versions:
Now the short-term implications of the current manual/domestic labor shortage are undeniably bullish for household workers. Those willing to do the work have never been more in demand. But the longer-term implications are laid out in a recent paper from the Atlanta Fed that examines the role of minimum wage hikes (certainly a topic of discussion from the AOC/Bernie Sanders crowd) under the catchy title, Macroeconomic Dynamics of Labor Market Policies
We find that in the short run, both small and large increases in the minimum wage have small impacts on employment and increase the labor income of the workers earning less than the new minimum. However, in the long run, the effects of the minimum wage greatly differ depending on the size of its increase: a small increase has a beneficial long-run impact on low-income workers in that it increases their employment, income, and welfare, whereas a large increase reduces the employment, income, and welfare of precisely the low-income workers it is meant to support. In either case, these long-run effects take time to fully materialize because firms slowly adjust their mix of inputs.
Whoops:
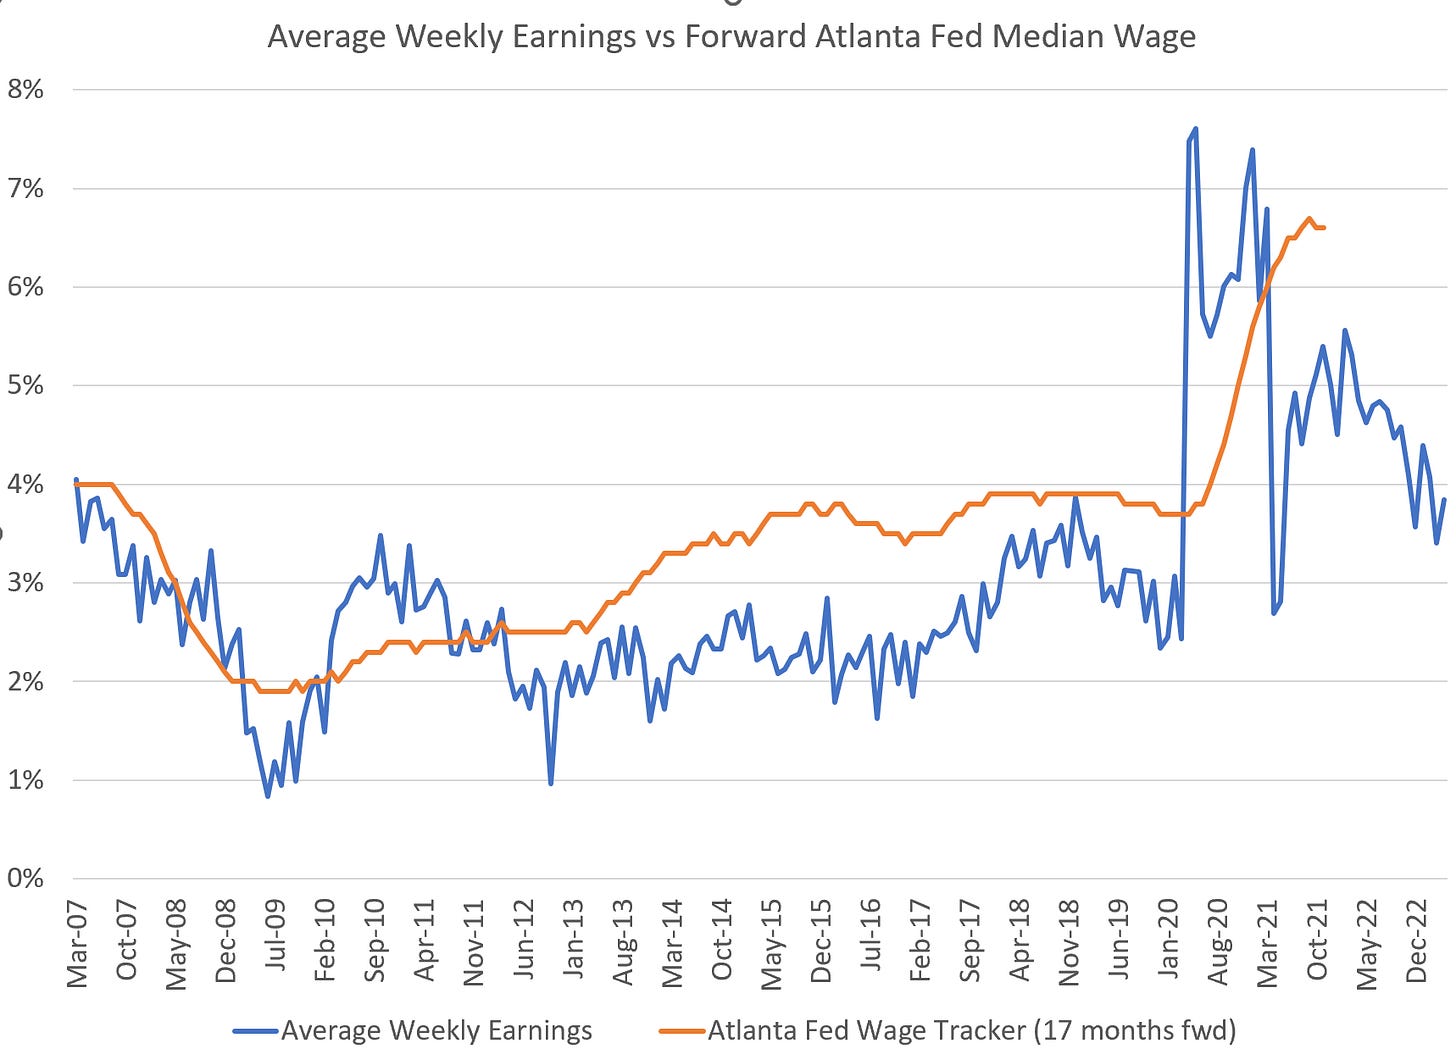
I hate to put it bluntly, but the cure for high prices is high prices. While many are tracking the Atlanta Fed Wage tracker as their rationale for expecting services inflation to remain high, this series, along with almost everything else the Fed is following, is a horribly lagging series. Note that in the 2000 and 2008 recessions, wage gains peaked DURING the recession and decelerated for over two years after. Perhaps it will be different this time, but again, the devil is in the details. The Atlanta Fed Wage Tracker is a three-month moving average (hence the smoothness). The “unsmoothed” data is available (but nobody watches it because that requires hard work). In the last month (April 2023), it had the most significant decline in its history, a 3.7std deviation fall:
The detail on the 12 per moving average suggests anything but a strong labor market looking forward:
And unfortunately, this concern is enhanced by the MULTIPLE aspects of the lagging nature of this data series. For example, the methodology of the Atlanta Fed Wage Tracker not only uses a three-month moving average but also uses a “rotating panel” of workers/households, very similar in construction to the now infamous Owner’s Equivalent Rent:
The survey features a rotating panel of households. Surveyed households are in the CPS sample four consecutive months, not interviewed for next eight months, and then in the survey again four consecutive months. Each month, one-eighth of the households are in the sample for the first time, one-eighth for the second time, and so forth. Respondents answer questions about the wage and sala’ wage and salary earnings in the fourth and last month they are surveyed. We use the information in these two interviews, spaced 12 months apart, to compute our wage growth statistic.
The survey is FURTHER biased toward lower-wage workers:
We further restrict the sample by excluding the following:
Individuals whose earnings are top-coded. The top-code is such that the product of usual hours times usual hourly wage does not exceed an annualized wage of $100,000 before 2003 and $150,000 in the years 2003 forward. We exclude wages of top-coded individuals because top-coded earnings will show up as having zero wage growth, which is unlikely to be accurate.
Does anyone else see a problem in a data series that ignores the top 15% of workers in a recession that appears to be LED by the top 15% of workers losing their jobs and facing diminished earnings prospects? My lament is not for the high-end workers but the LOW-end workers who are being led to the slaughter by Fed policy. Baaahhh humbug!
Meanwhile, the more current “weekly earnings,” which includes HOURS WORKED (hours are adjusted far faster than wages), suggests far less inflation risk. Only time will tell.
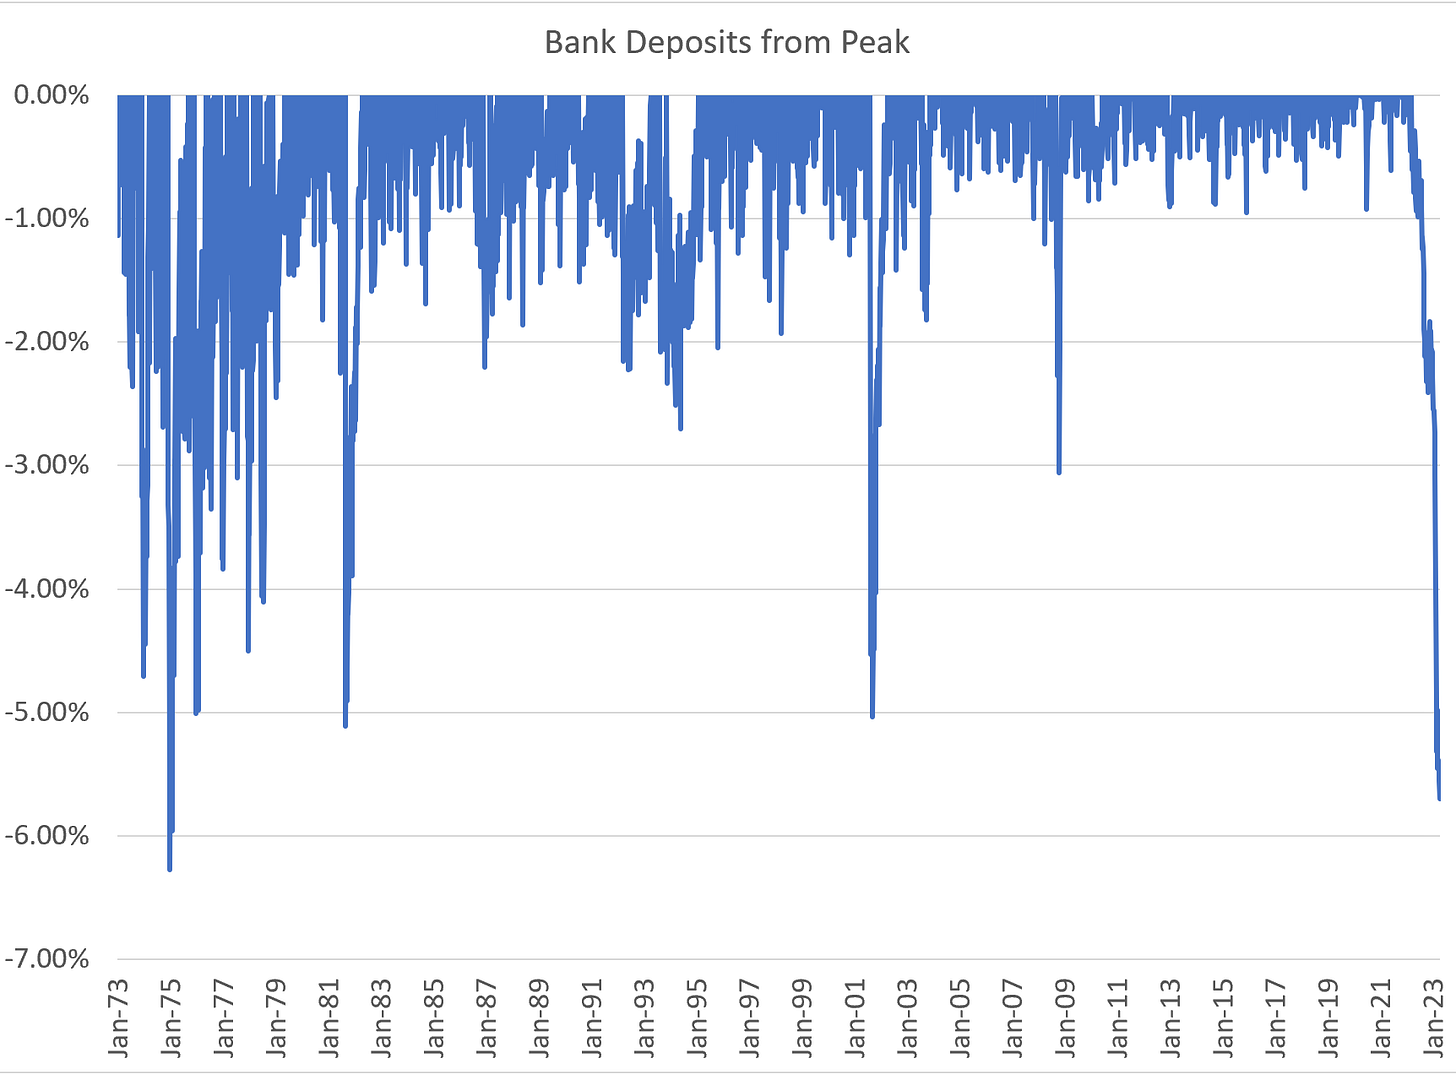
I promised a quick update on bank credit and the unfolding banking crisis. I know you’ve been told it’s over. It is not. This week we got more data on bank deposit drawdowns, and it’s grim. Reminder, this is data through May 10th, over a week ago.
Is it any wonder that US Bancorp is begging for deposits — at 60% annualized rates!
But that’s not the data series that’s catching my eye. Over on the bank CREDIT side, we see both nominal and real bank credit is now falling rapidly:
Even more uncommon is a NOMINAL decline in bank credit:
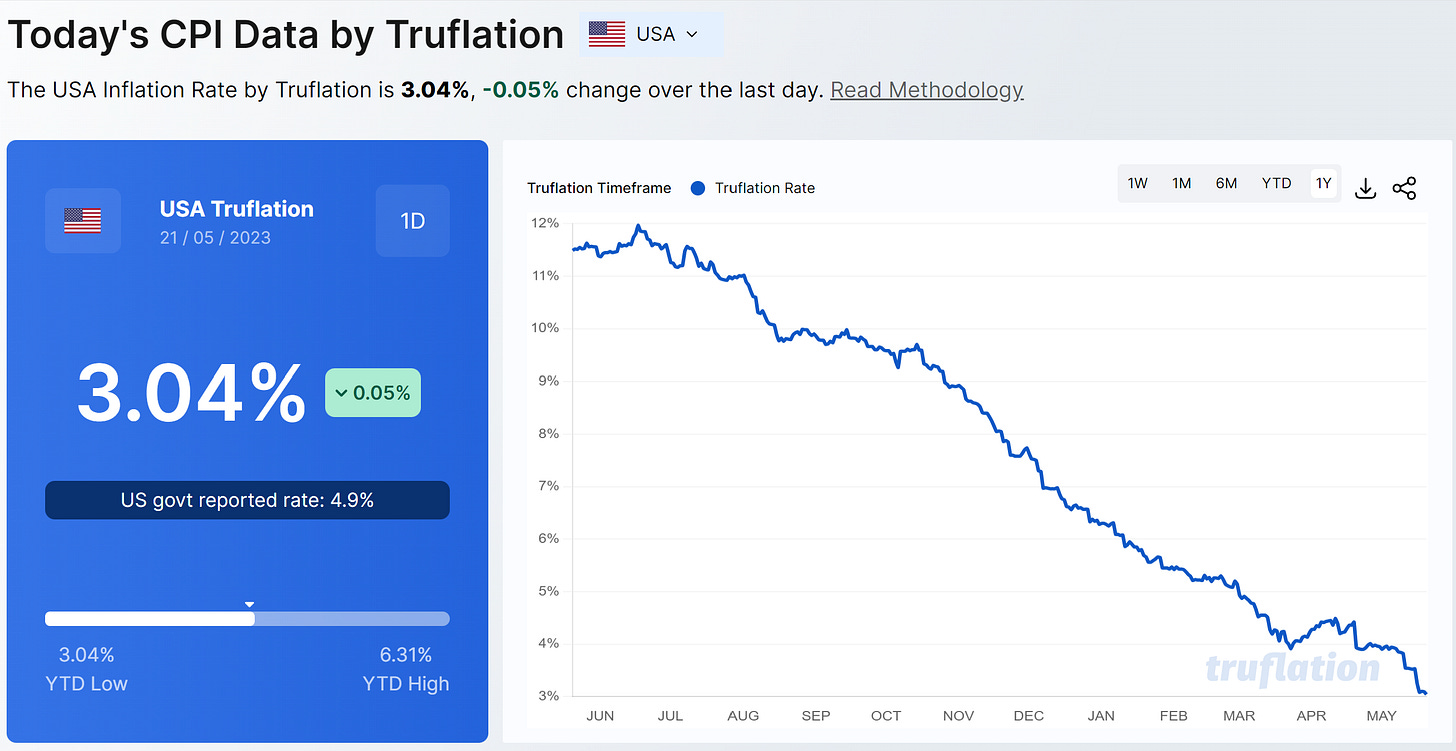
Simply put, there is no precedent for this event without a meaningful recession. The Fed’s fixation on trailing inflation metrics makes the observation more concerning while real-time metrics are now screaming deflation. The Truflation trailing annualized numbers may look sanguine, but check out the monthly and quarterly data:
Suddenly that plunge in the Atlanta Fed Wage Tracker “unsmoothed” doesn’t look so surprising.
As always, comments are appreciated!


“Does anyone else see a problem in a data series that ignores the top 15% of workers in a recession that appears to be LED by the top 15% of workers losing their jobs and facing diminished earnings prospects?”
This was one of my favorite details that you highlighted.
I just wanted to extend a thank you to you! It is extremely kind of you to be willing too give out scholarships for those who can’t afford the cost. Not something you see often these days, especially in the finance world.