An Ode to a Burning Urn of Cash
What mad pursuit? What struggle to escape?

Passive! Active! Let me tell you the difference. Because passive and active are voices on a mission. — M.C. Grammar
After two weeks of current event distractions, it’s time to return to the question of passive investing. I’m going to take this week to address questions raised in the comments to my March 5th piece, “Great Expectations.” We’ll go through all the questions — and introduce new topics — in future episodes, but the topic of cash is timely.
For clarity purposes, I’m going to try to consolidate questions and critiques into a series of Socratic discussions. Of course, I get to play Socrates. My questioners are noted skeptics and John Bogle-devotees. This means they are thoughtful, clever, and likely quite rich beyond their initial expectations. Despite my rapidly advancing age (and receding hairline), many of them have significant experience in markets, some even eclipsing my own. There is nothing which, for my part, I like better than conversing with the aged. I regard them as travelers who have gone a journey which I too may have to go, and of whom I ought to enquire, whether the way is smooth and easy, or rugged and difficult. Join me. You, dear reader, can choose to serve hemlock to the host in lieu of dessert wine should you be unpersuaded in the end. And no need to be passive! Jump in with comments and questions, please!

“There is only one good, knowledge, and one evil, ignorance.” — Socrates
Question: “I guess I am too much an empiricist to hold by your suggested model, and would like proof that passive investing actually changed the landscape”
This is the question that launched me on my journey. The starting gun, in 2016, was a brilliant paper by Lasse Pedersen whose intellect is the biggest thing at AQR, excluding Cliff’s ego. His paper, “Sharpening the Arithmetic of Active Management,” emphasized a footnote in Bill Sharpe’s iconic 1991 paper, “The Arithmetic of Active Management.” This 1991 paper is the origin of the analysis “all active managers must equal the market and therefore passive” that many have explicitly absorbed into their DNA as evidenced by several comments like this:
“If active managers are given funds and can only put them into stocks, then they will go into stocks and as a whole, they will go into the stock market at a market-cap weight definitionally.”
The footnote Lasse chose to emphasize exposes the obvious flaw in the theory of passive:
Footnote 4: We assume here that passive managers purchase their securities before the beginning of the period in question and do not sell them until after the period ends. When passive managers do buy or sell, they may have to trade with active managers, because of the active managers' willingness to provide desired liquidity (at a price).
Lasse observed:
“This equality is based on the implicit assumption that the market portfolio never changes, which does not hold in the real world because new shares are issued, others are repurchased, and indices are reconstituted so even “passive” investors must regularly trade. Therefore, active managers can be worth positive fees in aggregate, allowing them to play an important role in the economy: helping allocate resources efficiently.”
The sum total of my value-add was the observation that passive managers receive flows every day, regardless of index reconstitution, share issuance, etc., and therefore MUST trade every day. Again, lifting (and abbreviating) from Bill Sharpe’s paper:
Of course, certain definitions of the key terms are necessary. First a market must be selected -- the stocks in the S&P 500, for example, or a set of "small" stocks. Then each investor who holds securities from the market must be classified as either active or passive.
A passive investor always holds every security from the market, with each represented in the same manner as in the market.
An active investor is one who is not passive.
Simply put, there are NO passive investors by Sharpe’s definition. This means we are NOT looking for the impact of a magical creature that simply mimics the market by buying and selling before or after the market closes in some magical twilight period. Instead, we are looking for the impact of algorithmic investors operating under a mind-numbingly simple algorithm: “If you give me cash, then buy; if you ask for cash, then sell.”
Like any other active investor, they MUST impact the market. Claims that passive funds trade LESS are irrelevant. One push from a giant or 1,000 pushes from a gnat. Both matter.

This sets up our focus question for this essay:
“Somehow every manager claims they will hold cash when the market is expensive, but when you look at their long-term average results ... it equals the market.”
Even if we accepted the proposition that active managers and passive managers, in the aggregate, had to own the same underlying securities, the obvious exception here is “cash” — an active manager can always choose to hold cash in lieu of “stocks” (or more broadly “risk securities). There are a number of reasons a fund manager would choose to hold cash. Several empirical studies have attempted to identify the structural factors that determine cash holdings. One I would direct readers to is “The Determinants and Implications of Mutual Fund Cash Holdings: Theory and Evidence” by Sterling Yan.
“Equity mutual funds hold cash for several purposes. First, funds hold cash to meet shareholders’ redemption needs. Second, funds use cash to pay management fees and other expenses, and to make dividend and capital gain distributions. Third, fund managers may hold cash when they expect future stock market returns to be low (market timing).”
Now many may be drawn to charts like the following from Michael Hartnett to note that cash levels have not changed meaningfully over time:

The key problem here, as I have noted directly to Michael, and with his acknowledgment, is that “FMS investors” indicates “Fund Manager Survey” and passive funds do not respond to surveys. Too expensive. So what we’re seeing here is self-declared ACTIVE fund allocations to cash. You’ll note that cash rises at market troughs, e.g. April 2020, and falls at market peaks, e.g. 2021. The majority of this change is not a function of market timing but rather asset price volatility. If cash is 4% of assets at a market peak and markets fall 20%, then cash is now 5%. If they fall another 20%, cash is now over 6%.
Secondly, this is a measure of the average cash level, not the value-weighted cash level (giving larger weight to larger funds). Returning to Yan, “I find a strong and negative relation between fund cash holdings and fund size. Doubling the fund asset base is associated with a decrease in cash balance by approximately 56 basis points.” (page 78). So even within the active management universe, this metric overstates cash levels.
But the far more important point is that index funds are not captured in this data set. Instead, when we look at holistic measures of cash levels inside mutual funds (and ETFs), we discover that we’ve plummeted in absolute level of cash holdings — and that this decline began well before interest rates plummeted. Unfortunately, I don’t have great data beyond 2000 easily available for the aggregate cash levels, but again we can use Yan:
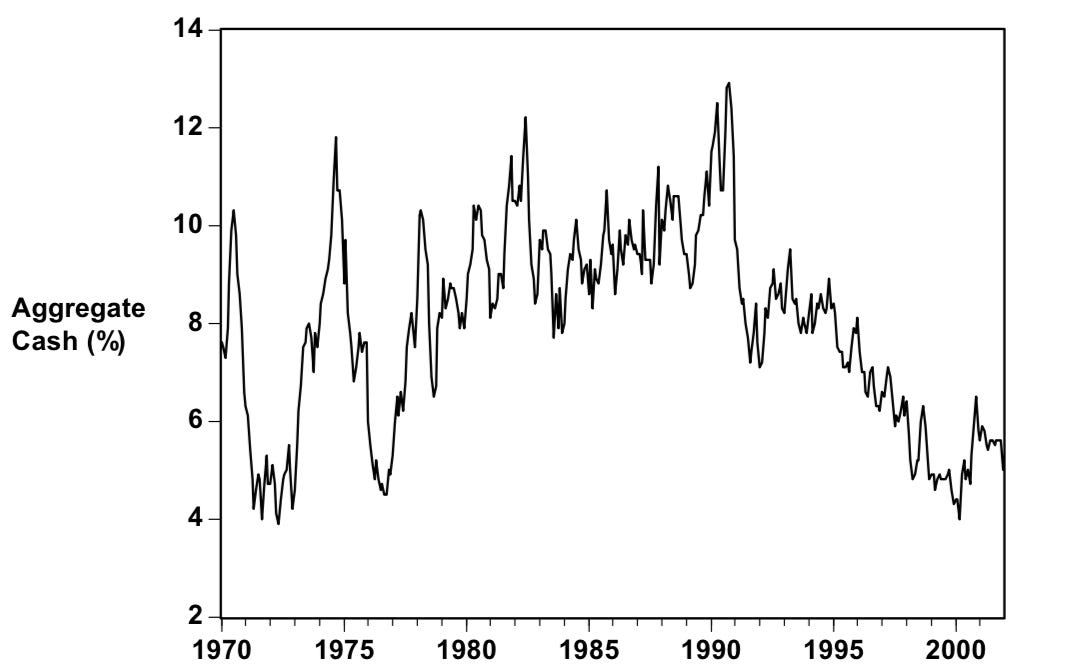
Or look within a sector, for example, Equity Growth through 2010:

Regardless, it doesn’t change the outcome — aggregate cash holdings have fallen sharply as a percentage of assets. This trend has continued since 2010 for one very simple reason. Passive managers do not hold cash. Exhibit 1 — the holdings of the Vanguard Total Market Index:

$155 million in cash versus $915B in assets. 17bps of cash.
The statement that is obviously on the lips of skeptics, “OK, so active managers average 5% cash, and passive managers only hold 17bps of cash. Big deal. Markets go up 5%.”
This is a misunderstanding and sits at the core of the problem. Cash, short of burning it, which creates fiduciary risk, cannot be created or destroyed. If active managers are redeemed and replaced with passive managers who want to hold less cash, the ONLY solution is for equity prices to rise. Let’s go through the math using a simple 10bps for passive management cash levels. Imagine there is a simple model of how the market “used to be” where all the funds are held by Active managers, who, on average, carry 5% cash. If we assume $1,000 total invested, then the equity market cap is $950 by definition, and cash in funds is $50. Let’s see what happens when we move 1% of funds to passive managers:

Note that it’s not a solution to have active managers sell $9.50 AND passive managers buy $9.99. That is not a transaction, as buying does not equal selling. To arrive at a solution, we must solve iteratively for where buyers are equal to sellers. As a result, equities appreciate by more than 1% for a 1% allocation to passive. Now let’s solve for higher levels of passive:

The orange line, the value of equities, rises 50x as passive goes from 0% to 100%, and aggregate cash levels fall from 5% to 0.1%. That’s a far cry from 5%. And note that we're just beginning the noticeable ascent at our current level of ~45% passive. At this level, equity valuations have roughly doubled simply from cash-level declines. A hypothetical exercise that comes frighteningly close to empirical, even at the 2022 Q3 trough in equity valuations (courtesy of Ed Yardeni):
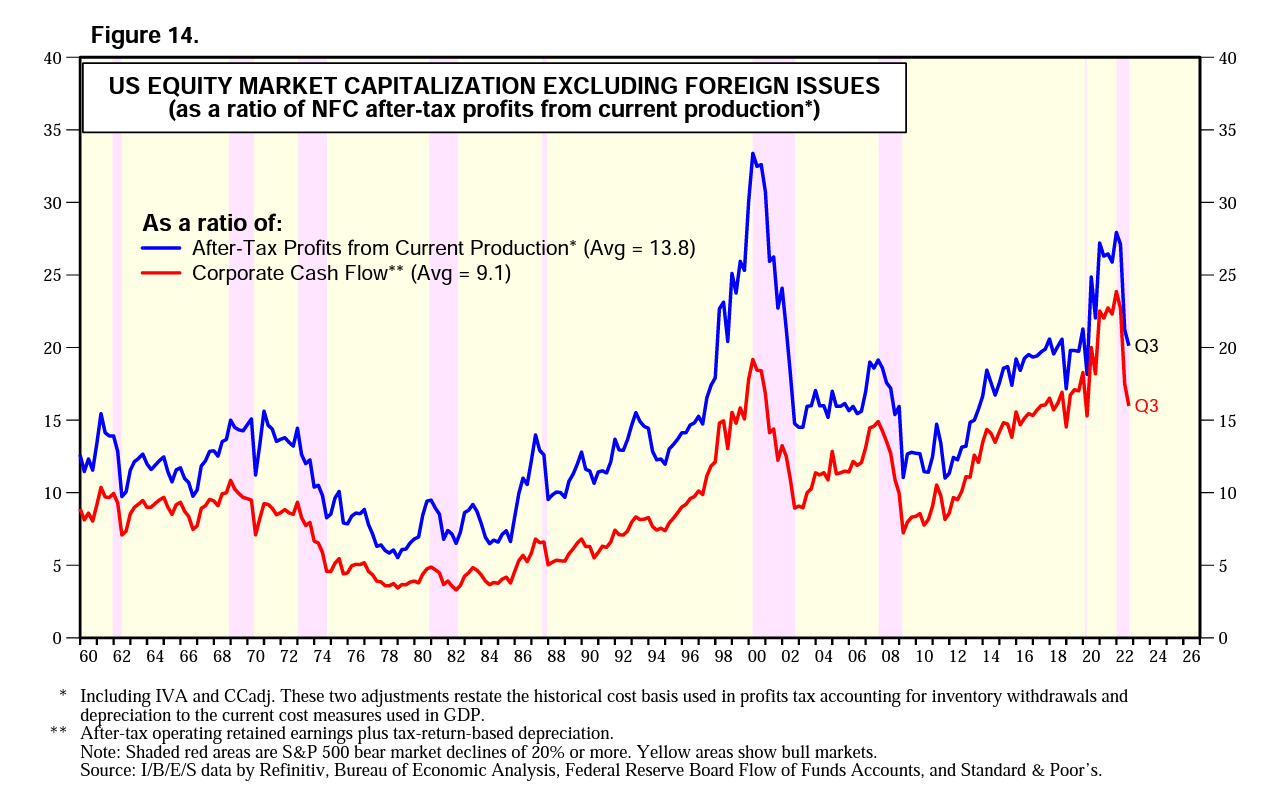
This is even more apparent using metrics like sales ratios which reduce the impact of current levels of record profitability:

Now let’s go a step further and evaluate the risks that are created by this dynamic. Again, the literature comes to our aid. In this case, the ECB with “A theoretical model analysing investment funds’ liquidity management and policy measures”
“Our results show how mutual funds use cash holdings to manage the risk of fire sales created by their liquidity transformation activities and suggest that they may not hold enough cash to fully mitigate fire sale externalities.” Giuzio et al, 2021
Remember, fund managers hold cash to mitigate the risk of forced liquidations on redemptions. The ECB notes that, on average, they do not hold enough.
“Our model shows that investment funds can have incentives to operate with a higher level of liquidity mismatch than might be desirable from a macroprudential perspective.”
Why? Because returns are typically negatively affected. Bill Sharpe alluded to this dynamic in his 1991 paper:
“For example, returns on equity mutual funds with cash holdings are often compared with returns on an all-equity index or index fund. In such comparisons, the funds are generally beaten badly by the index”
In general, the trend since 1991 has been for managers to be compared to a “passive” benchmark (Sharpe explicitly recommended this in his paper). As a result, cash has become viewed simply as a market timing exercise rather than a liquidity management tool and high levels of cash holdings are typically viewed unfavorably by allocators. But this is creating a macroprudential risk per the ECB.
In the aftermath of Silicon Valley Bank, where we discovered that liquidity mismatches are a real risk for financial systems, how can we interpret the behavior of an entity like Vanguard, with nearly $1 Trillion in a single fund carrying only $150MM in cash? There’s only one word: “Inconceivable.”
And how are we to interpret a regulatory regime that mechanically directs 85 cents of every retirement dollar into passive choices? One of the classic blunders.

As always, comments are appreciated!
So what you're saying is, we could have a run on the S&P 500... inconceivable!
Seriously though, the outsized Boomer demographic hitting their age of required minimum distribution, which are 3.6% per year in year one, and increases every year, would allow the quant minded to fairly accurately model this liquidity demand.
The saving grace might be that Boomers as a demographic were late to get involved in IRA's and passive compared to Gen X and Millennials, which had them available (some might say foisted) practically from the start of their careers. So, this time bomb might have another 20 years yet before detonation.
On the other hand, if you assume the median Boomer is 72, in 20 years, they will be 92 and staring down a 9.2% mandatory withdrawal liquidity demand. Assuming they make it that long, of course, which according to our Gompertz Interval math suggests less than 1/3rd will. On the third hand, the heirs of the unfortunate 2/3rds are required to withdrawal at an even faster rate (I think). Lots of moving parts, but the beauty of demographics, like the motion of the planets, is it's all tractable for those motivated enough to work through the math.
I have never had an entire well-researched blogpost made in response to my questions. So I am wowed by this post. Really bravo!
I hate to burst your bubble, but I am not a wizenned, rich boglehead, but a 26 year old starting my investment journey, not ahead of you but far far behind, treading the path you have already been on.
Phenomenal blogpost and a lot to think about. Thank you!
My question is and this may be incorrect because it is off-the-cuff. Ultimately, cash, bonds, and stocks are all simply held through excess savings of the public sector, therefore, higher P/Es can be caused by changes in what percentage of these savings are held in each asset (as you propose) OR by an imbalance between excess savings and these assets (too much cash chasing too few saving vehicles). Could higher PEs and lower cash be due to the fact that there is just simply too much wealth in the world vs. the savings vehicles they can go in. Too many people who are wealth vs. entrepeneurs who use this wealth to make savings vehicles (bonds and stocks)?