A Semi-Theory of Almost Everything
Who was actually setting semiconductor prices this spring?

This is going to be a relatively long read. I would have written a shorter piece, but I did not have the time — or, more honestly, the skill to compress two weeks of work into fewer words.
“I have only made this letter longer because I have not had the leisure of making it shorter.” — Blaise Pascal
I have been working nonstop on projects with hard deadlines; last week’s note was the casualty compounded by computer malfunctions that require me to replace my primary computer. As I am moving in two weeks, I am suffering through the snafus rather than biting the bullet and setting up a system twice.
Excuses aside, this one is denser than usual, and I think it matters. Roughly 40% of the Q2 semiconductor price move, and about sixty percent of the shift in the tape’s character, can be explained by a measurable change in how holders of levered products behaved, plus the arrival of one large price-insensitive vehicle. The plumbing changed. If it can happen in semiconductors, it can happen in other places where the same structures exist.
The Philadelphia Semiconductor Index rose 88% in the second quarter of 2026. It did so at 60% annualized volatility, nearly double its twenty-year average. Micron gained 230% over those three months while Nvidia, the largest stock in the index and the supposed center of the AI trade, managed about 15%. Then, in three weeks of July, the index gave back 17%. Micron, the most crowded and extended stock in the market, fell at almost exactly its ordinary, pre-mania sensitivity to the index -- a coincidence we will take apart.
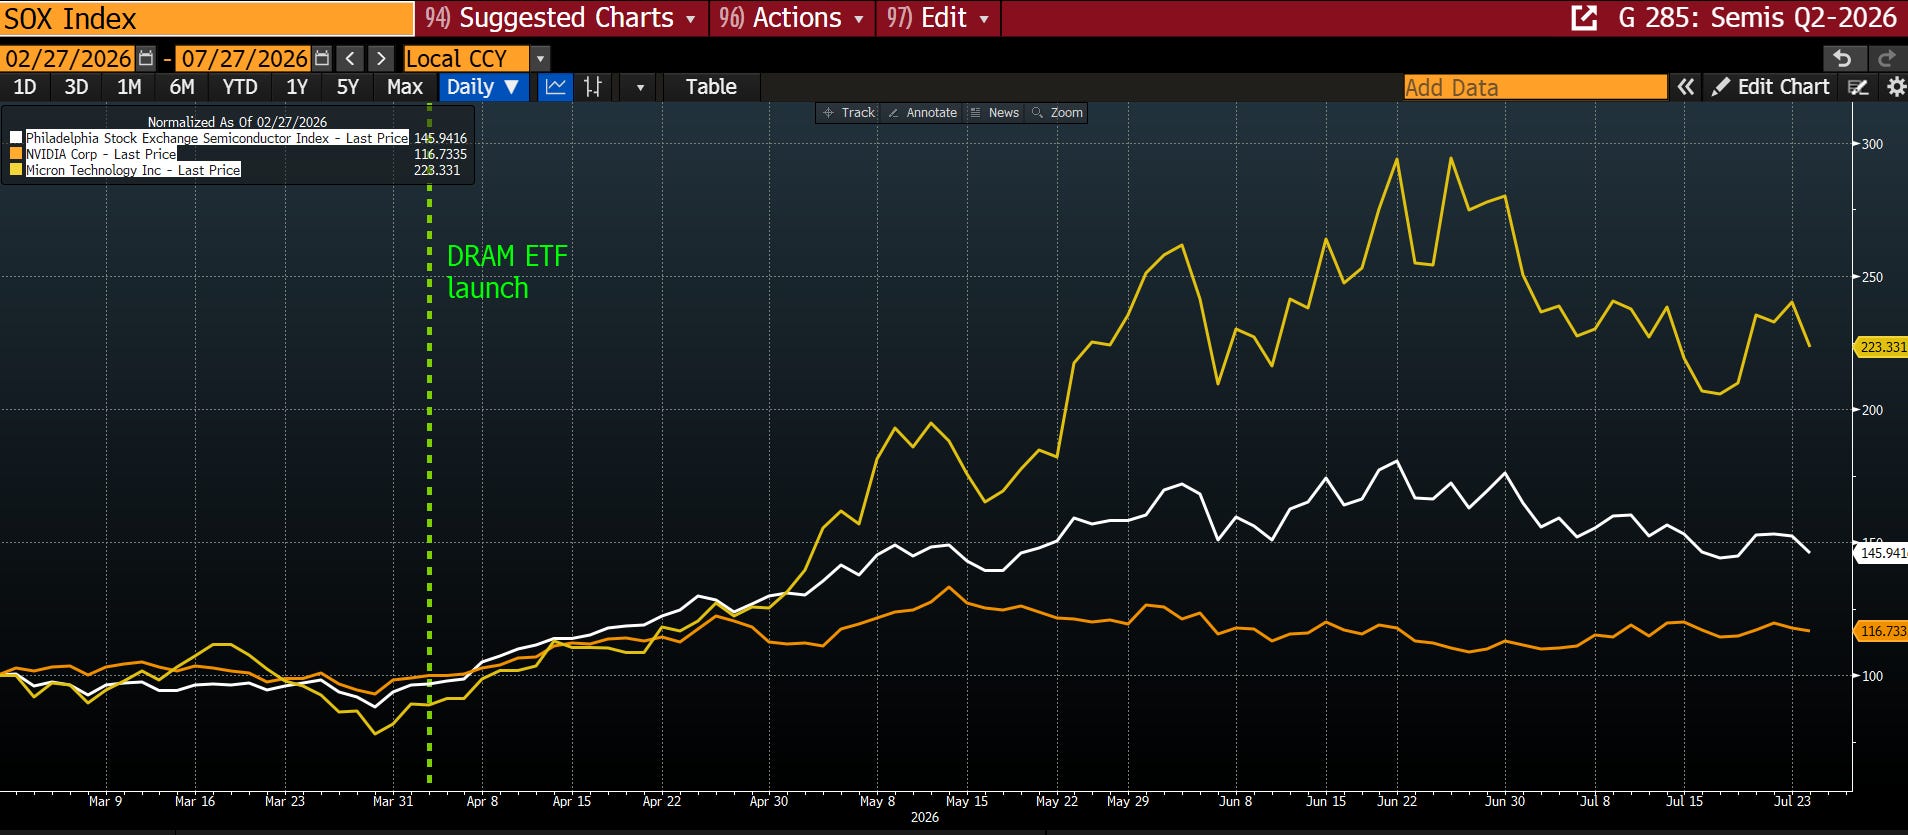
My argument is that a surprisingly large part of this pattern was mechanical. The size of the spike, the violence of the daily swings, the identity of the winners, and the shape of the unwind were driven by measurable flows through a specific set of exchange-traded products. The behavior of the people who hold those products changed at an identifiable date, the first week of April 2026, and the consequences can be reproduced by a model that was calibrated entirely on data from before the change. Over the past several weeks, the team at Tier1 Alpha Research and I assembled shares-outstanding and price data for every levered and unlevered semiconductor ETF, every single-stock levered wrapper on a SOX constituent, and the largest sector fund launch in history, and ran the arithmetic. This post is the full accounting: what the machine is, how it changed, what it did, and which of my own hypotheses failed along the way.
Four key findings:
First, for most of the past decade the levered ETF complex was a stabilizing presence in this market. Not because the products are benign, but because their holders acted as a counterweight, selling into strength and buying into weakness consistently enough to recycle the funds’ own destabilizing trades. That behavior can be measured, and the measurement changed abruptly in April.
Second, when the recycling weakened enough to stop absorbing the funds' gross rebalance demand, a machine that had spent a decade canceling itself began injecting momentum flow into the tape: $76 billion of gross rebalance demand in the June quarter, nearly half of it unrecycled, for a net footprint of +$33 billion where the old behavior would have produced roughly nothing. The volatility regime of the entire index changed within weeks. A model containing nothing but mechanical trading rules, with no sentiment and no psychology, and with its market physics calibrated entirely before the break, reproduces roughly sixty percent of that change.
Third, the winners were chosen by a different machine entirely: a $26 billion sector fund, launched on the exact day the regime broke, that generated roughly $5 billion of exposure demand for a single mid-cap stock in one quarter -- demand decoupled from the day’s return, arriving whether the tape was up or down. The levered complex changed the character of the tape. The new fund chose its destination.
Fourth, the single-stock levered wrappers that have multiplied across the index since 2024 matter far less than their reputation suggests, with one enormous exception. Readers who follow the launch announcements may be surprised; anyone who has looked at the asset totals will not be, because the totals say more about an ETF industry scrambling for survival than about investor demand. The tests we designed to convict the wrappers came back empty, twice, and the model told us why before the data did.
Start with the physics.
What a daily reset actually does
A leveraged ETF promises some multiple, call it L, of its index’s daily return. To keep that promise it must trade every single day. If the index moves by r, the fund’s assets move by L times r, but the exposure it needs is L times its new, larger (or smaller) asset base. The gap between what it holds and what it needs works out to L(L−1) times assets times r. For a 3x fund that coefficient is 6. On a day the index rises 3%, a $20 billion fund must buy $3.6 billion of exposure at the close. On a day the index falls 3%, it must sell the same amount.
Here is the detail most people miss: the inverse fund is not the other side of this trade. For a −3x fund, the coefficient is (−3)(−4) = 12, and the direction is the same. After an up day, the bear fund must buy to cover; after a down day, it must sell more. Bull and bear both chase the day’s move. The levered complex as a whole is built to trade with momentum, in size, at the close, and everyone on Wall Street can compute its order in advance.
The second piece of physics: volatility drag. A levered fund’s long-run growth rate follows a simple formula:
growth ≈ L·μ − (L²·σ²)/2
L is the leverage. μ is the index’s average yearly return. σ is the index’s volatility. The first term is what the marketing promises: three times the return. The second term is the toll, and it grows with the square of both leverage and volatility. Double the volatility and the toll quadruples. Triple the leverage, and it rises ninefold. If you’re feeling adventurous and bold, head over to London for 5x leverage -- the English can no longer field a military, but they have no problem supplying the world with tools for punting.
To see what the toll collects, assume the index averages a 20% return -- a spectacular market, every single year -- and watch what happens to $100 over one year as volatility rises:
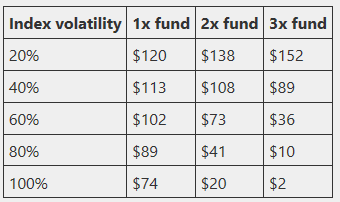
Look at the bottom row. The index is averaging a 20% return, and the 3x fund turns $100 into $2. Nothing crashed. The toll simply compounds at nine times the rate of the market’s chop, and above 40% volatility, no realistic return outruns it. At the SOX’s twenty-year realized volatility of 31%, a 3x product needs the index to return 14.4% a year just to break even. The SOX, one of the great compounding machines in market history, delivered 17.2% a year over that stretch. Even riding one of the great compounding indices of the era, most of the apparent benefit of 3x leverage was consumed by variance before fees and financing. Now apply this spring’s volatility: at 60% realized, the 3x breakeven jumps to 54% per year, and the toll itself is nine times the squared volatility, halved -- 9 × 0.36 / 2, or 162% a year, roughly 64 basis points every trading day taken out of the fund. No index delivers that. Only a strong trend can outrun the drag, and the moment trend turns sideways, the product bleeds.
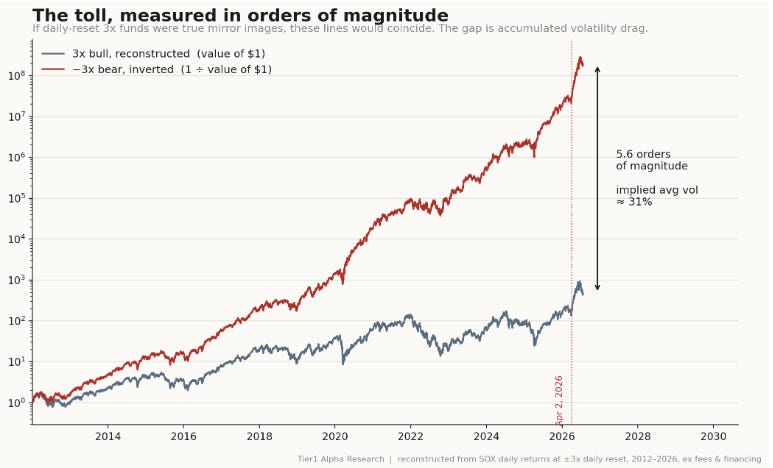
You can watch the drag with your own eyes. Because (1+3r)(1−3r) = 1−9r², the product of the bull fund’s value and the bear fund’s value shrinks every day by nine times the day’s squared return, no matter which way the market went. Direction cancels out; drag accumulates. We reconstructed both funds’ value paths from daily index returns back to 2012 and plotted the bear fund on an upside-down axis against the bull. If the two funds were true mirror images, the lines would sit on top of each other. Instead they drift apart by five and a half orders of magnitude, and the size of the gap is a running meter of accumulated volatility. Work backward from the gap and you recover an average volatility of 31.6% -- almost exactly the measured twenty-year figure. At today’s volatility, that gap widens by a factor of 25 every year.
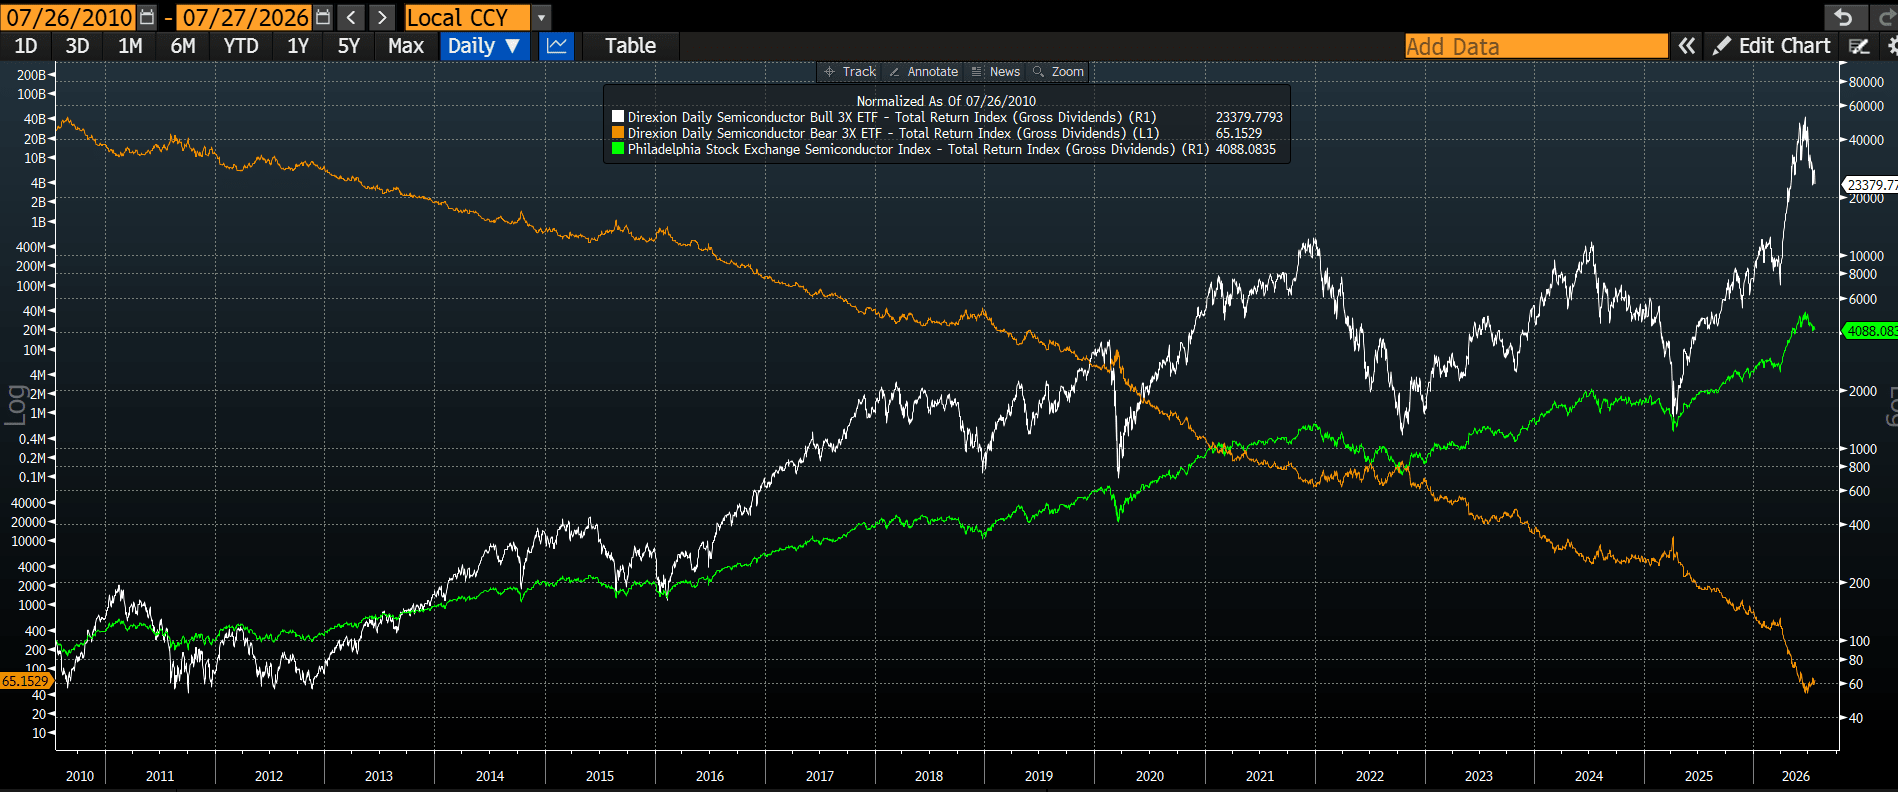
SOX Index vs Levered ETF daily index cumulative total returns 2010-2026
The fund that cannot die
That brings us to the strangest object in modern market structure: the inverse levered fund with no survivors and no shortage of volunteers.
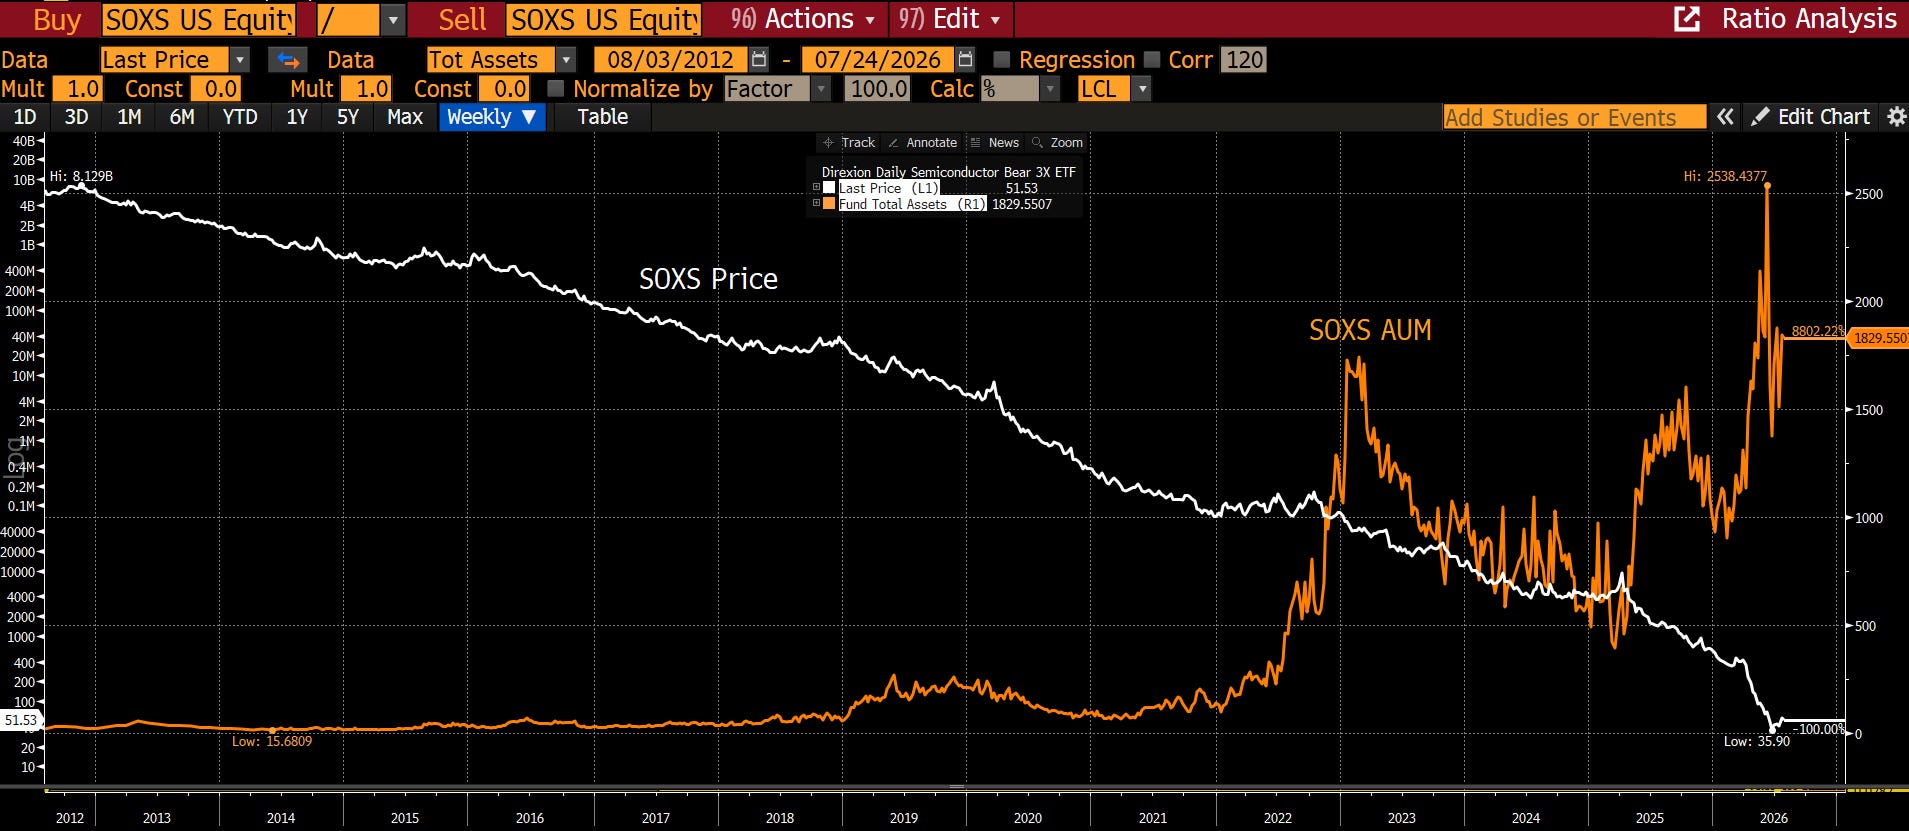
SOXS, the 3x bear fund on semiconductors, has lost roughly 99.9999991% of its value since 2012. Eight orders of magnitude. Over that same period, the dollars invested in it never left a band between about one-tenth and ten times its starting size, because investors kept feeding it. Cumulative inflows since 2012 total about thirty-eight times the fund’s original asset base. Essentially every dollar that ever entered was destroyed, and the fund’s current assets consist entirely of money that arrived recently. The business works because the pool is always full and the new arrivals have no memory of the yellow cloud from the prior period. Reverse stock splits keep the share price presentable, inflows keep the assets stable, and the fund functions, economically, as a permanent fee stream for its sponsor. Who pays? A rotating cast betting on a top or hedging a portfolio -- and, more importantly, the professionals positioned on the other side of them. Recall the pair-decay arithmetic: the two funds bleed value between them, and professionals run short positions against both legs to collect the bleed. That trade is easy to oversimplify. The product of the two NAVs decays mechanically, but a static short of both funds is exposed to their sum, and the sum grows in a sustained trend even while the product shrinks. The harvest pays well in choppy, directionless markets, but it must be rebalanced daily, financed, and borrowed, and it loses money in exactly the kind of relentless trend this spring produced. Its first input is shares to borrow. Borrowed shares must exist before they can be shorted, which means someone must create them, which means the harvest runs only as long as fresh capital keeps replenishing the melting fund. The harvest needs the standing wave the way a distillery needs corn.
The trade also has a governor. You can only short what you can borrow, you can only borrow against margin, and margin is priced by prime brokers who demand more collateral as volatility rises. So the harvest’s capacity shrinks at precisely the moment its yield explodes: the same volatility that doubles the decay doubles the collateral bill, and past some point the broker, not the opportunity, sets the position size. A trend adds a third jaw to the vise. The short bull leg explodes in a melt-up, so the harvesters’ forced exit is a purchase, made at the top, in size. A short-volatility trade carried out of its own best harvest season by its financing is not a new story; February 2018 retired an entire family of short-volatility products in a single afternoon. It matters here because the harvesters are a load-bearing part of the machine. Their borrow demand drives creations, their creations replenish the bear fund, and when volatility forces them to shrink, one more stabilizer switches off exactly when it is needed.
The pattern repeats at every scale. In the past year alone, the −1x Micron fund absorbed $2.7 billion of cumulative inflows and currently holds $48 million. The common narrative is “Silly bears!” Every bear fund in this complex shows the same signature. The signature can be measured.
Measuring who does what
For each fund, take the growth in its shares outstanding and compare it to the growth in the fund’s own value per share. The relationship between the two is a number I will call "flow elasticity." It describes what the holders, in aggregate, do when the fund moves: it is their operating rule.
An elasticity of zero means holders sit still. Share counts don’t respond to performance. That is what a buy-and-hold allocation vehicle looks like, and the plain, unlevered index funds show it. SOXX comes in at −0.08 and SMH at +0.03, statistically nothing. Their share counts grind upward on institutional schedules, indifferent to the daily tape. That zero is the operating rule of the passive majority of American equity ownership -- a majority the fund-level statistics undercount by half, as Chinco and Sammon showed by measuring reconstitution-day volume instead of counting tickers -- and its immovability is the foundation of everything my broader work argues about inelastic markets.
An elasticity of −1 means holders keep a constant dollar amount invested. Every 1% gain in the fund is met with a 1% redemption of shares. The profit is skimmed; the bet stays the same size. The levered funds cluster near this behavior, and they have for as long as the data runs. From 2013 through the end of 2024, SOXL’s holders ran an elasticity of about −0.4, and the relationship tightened as the fund grew: over the last five years of that window, the figure is −0.46 with a strong fit. As the mania built through 2025, the skimming intensified toward −0.7. The more the fund made, the harder its holders leaned against it. The past twelve months are the vivid illustration: SOXL’s value per share touched ten times its starting level, and holders redeemed a cumulative 1.47 times the fund’s starting assets in cash, holding the fund’s total dollar size nearly flat until the final melt-up. SOXS holders have run near −1.0 for over a decade, beyond constant dollars and into doubling down, and pushed deeper as the squeeze arrived: over the past year they over-replaced every loss, pouring 3.16 times the starting assets into a fund that fell 96%.
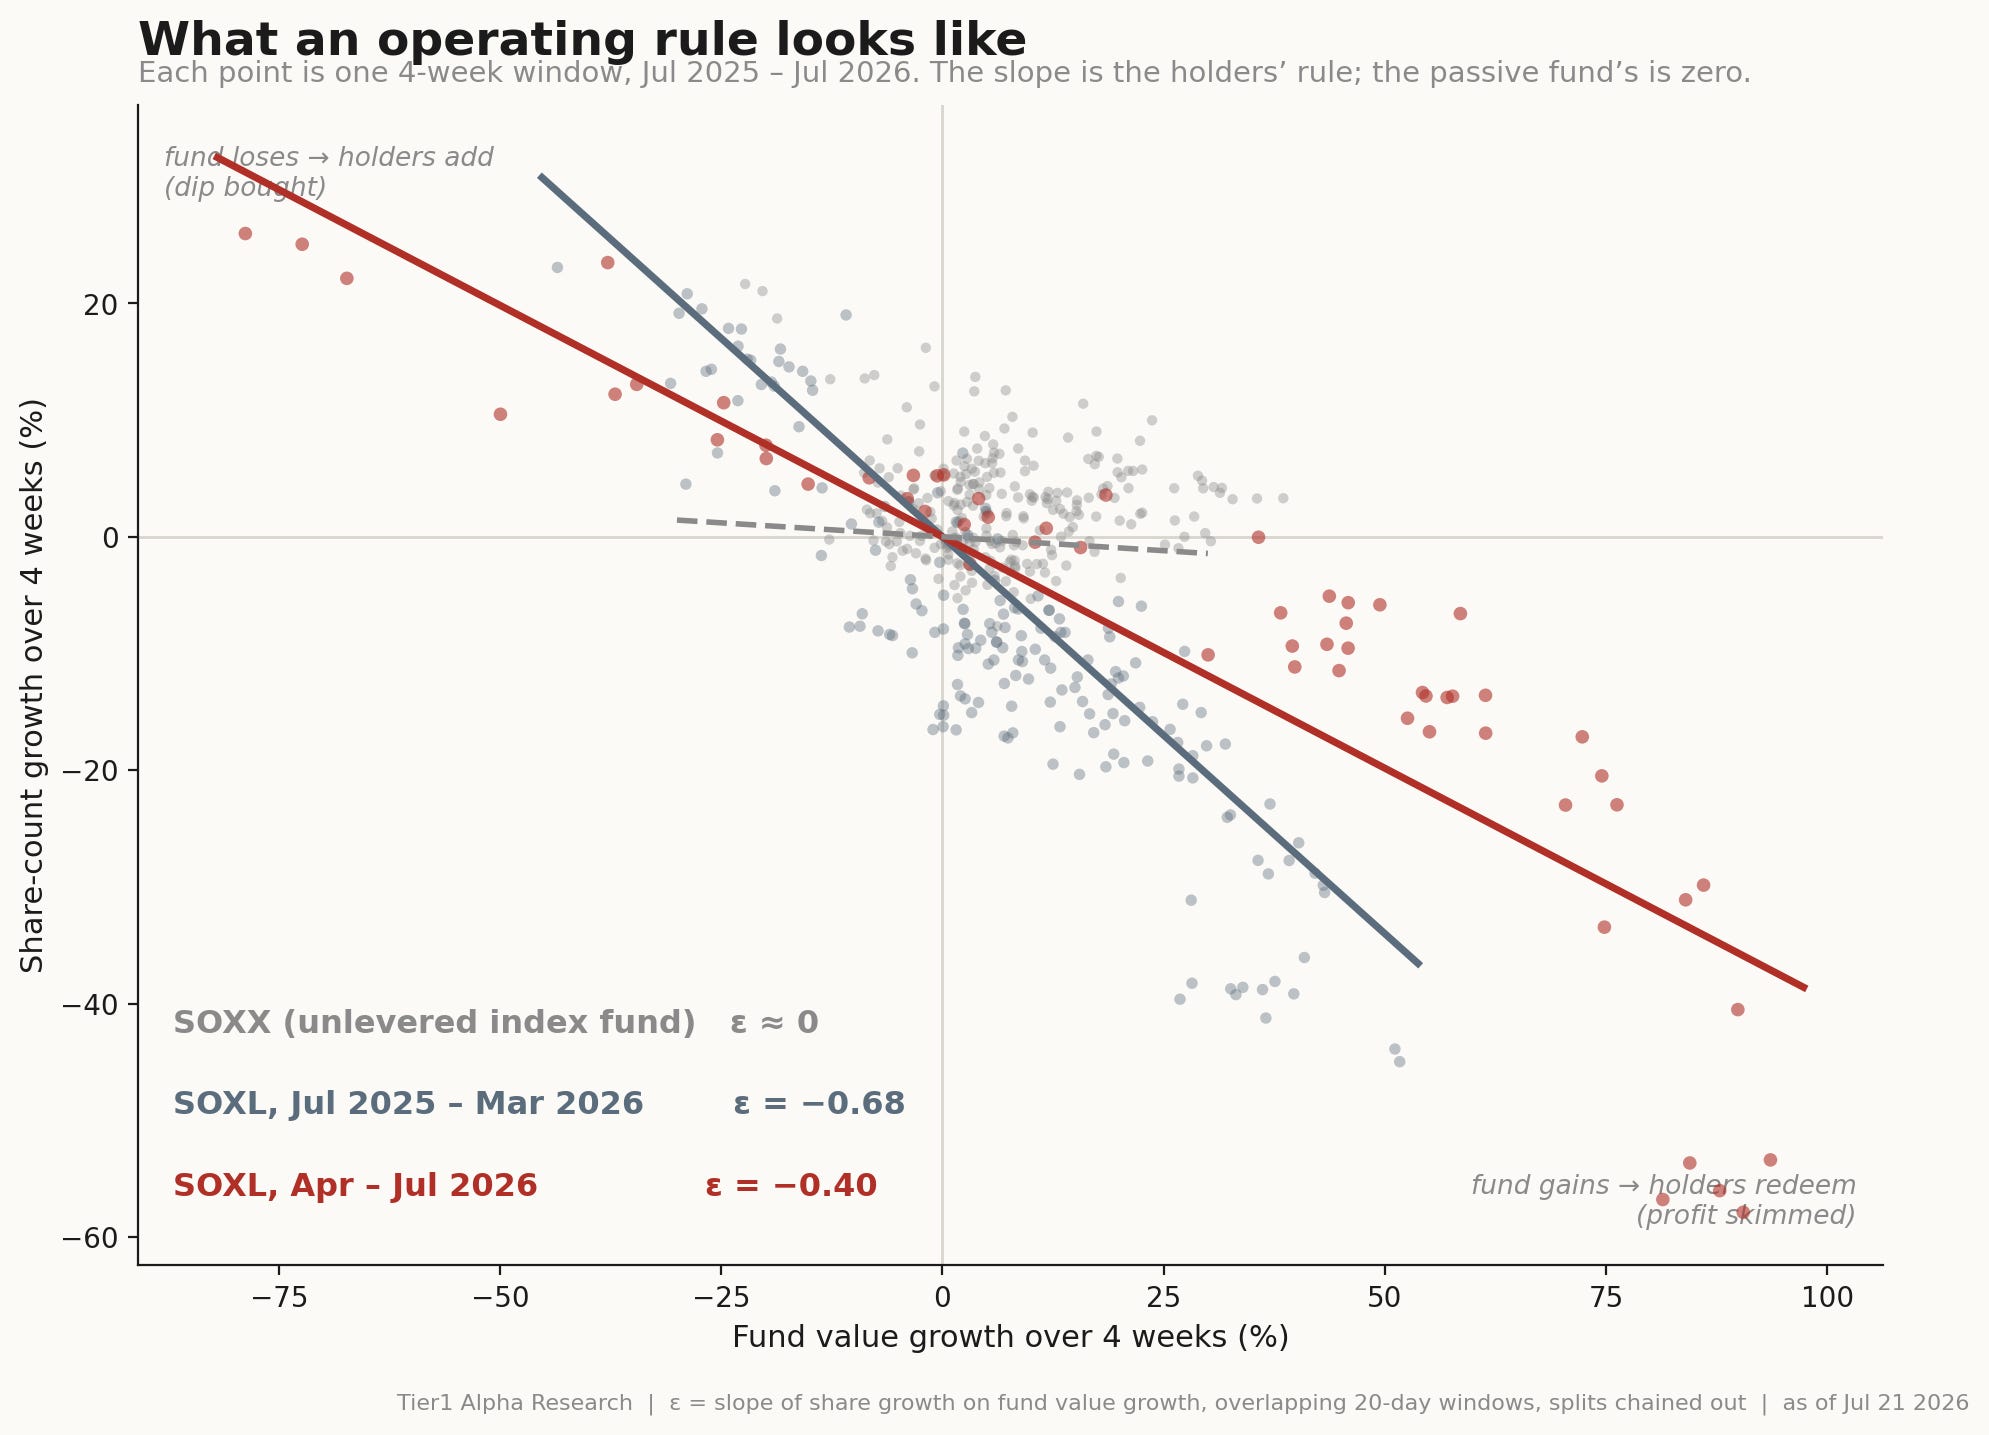
This inverts the famous rebalance trade. The fund itself must buy 6 units per unit of assets per unit of return after an up day. But holders running an elasticity of −0.5 redeem into that same up day, and their redemptions force the fund to sell about 4.5 of those 6 units right back. The net footprint is about a quarter of the headline number. On the bear side, at −1.2, the offset reaches roughly 90%. For years, the levered complex’s momentum trading has been mostly recycled by the profit-taking and dip-buying of its own investors. The machine was loud, but it swallowed most of its own exhaust.
The recycling shows up in the price data. From July 2025 through March 2026, a period in which the SOX rose 37%, SOXL’s holders ran an elasticity of −0.68, and the levered complex was a net seller of $10 billion into the rally. The funds’ rebalancing demanded $28 billion of momentum buying over those months; holder redemptions more than fully absorbed it. Over the same stretch, the index displayed strong mean reversion. A big up day tended to be followed by give-back: daily returns had a correlation of −0.19 with the previous day, and a strong week surrendered about a fifth of itself the following week. That give-back was the recycling flow hitting the market. Trends could not extend because the complex’s own holders sold every extension.
April 2026: the recycling breaks
Then the operating rule changed. From April through July, SOXL’s elasticity weakened from −0.69 to −0.40. Holders skimmed forty percent less of each gain. The recycling did not stop; it stopped being enough. Against $72.4 billion of rebalance-driven buying in the June quarter, the sign of the complex’s net footprint flipped: the net trade was +$22.5 billion. The same behavioral machinery that had produced eleven billion of net selling across eight and a half months of rally produced twenty-two billion of net buying in a single quarter. The swing between what happened and what the old behavior would have produced against the same tape is roughly $58 billion per quarter.
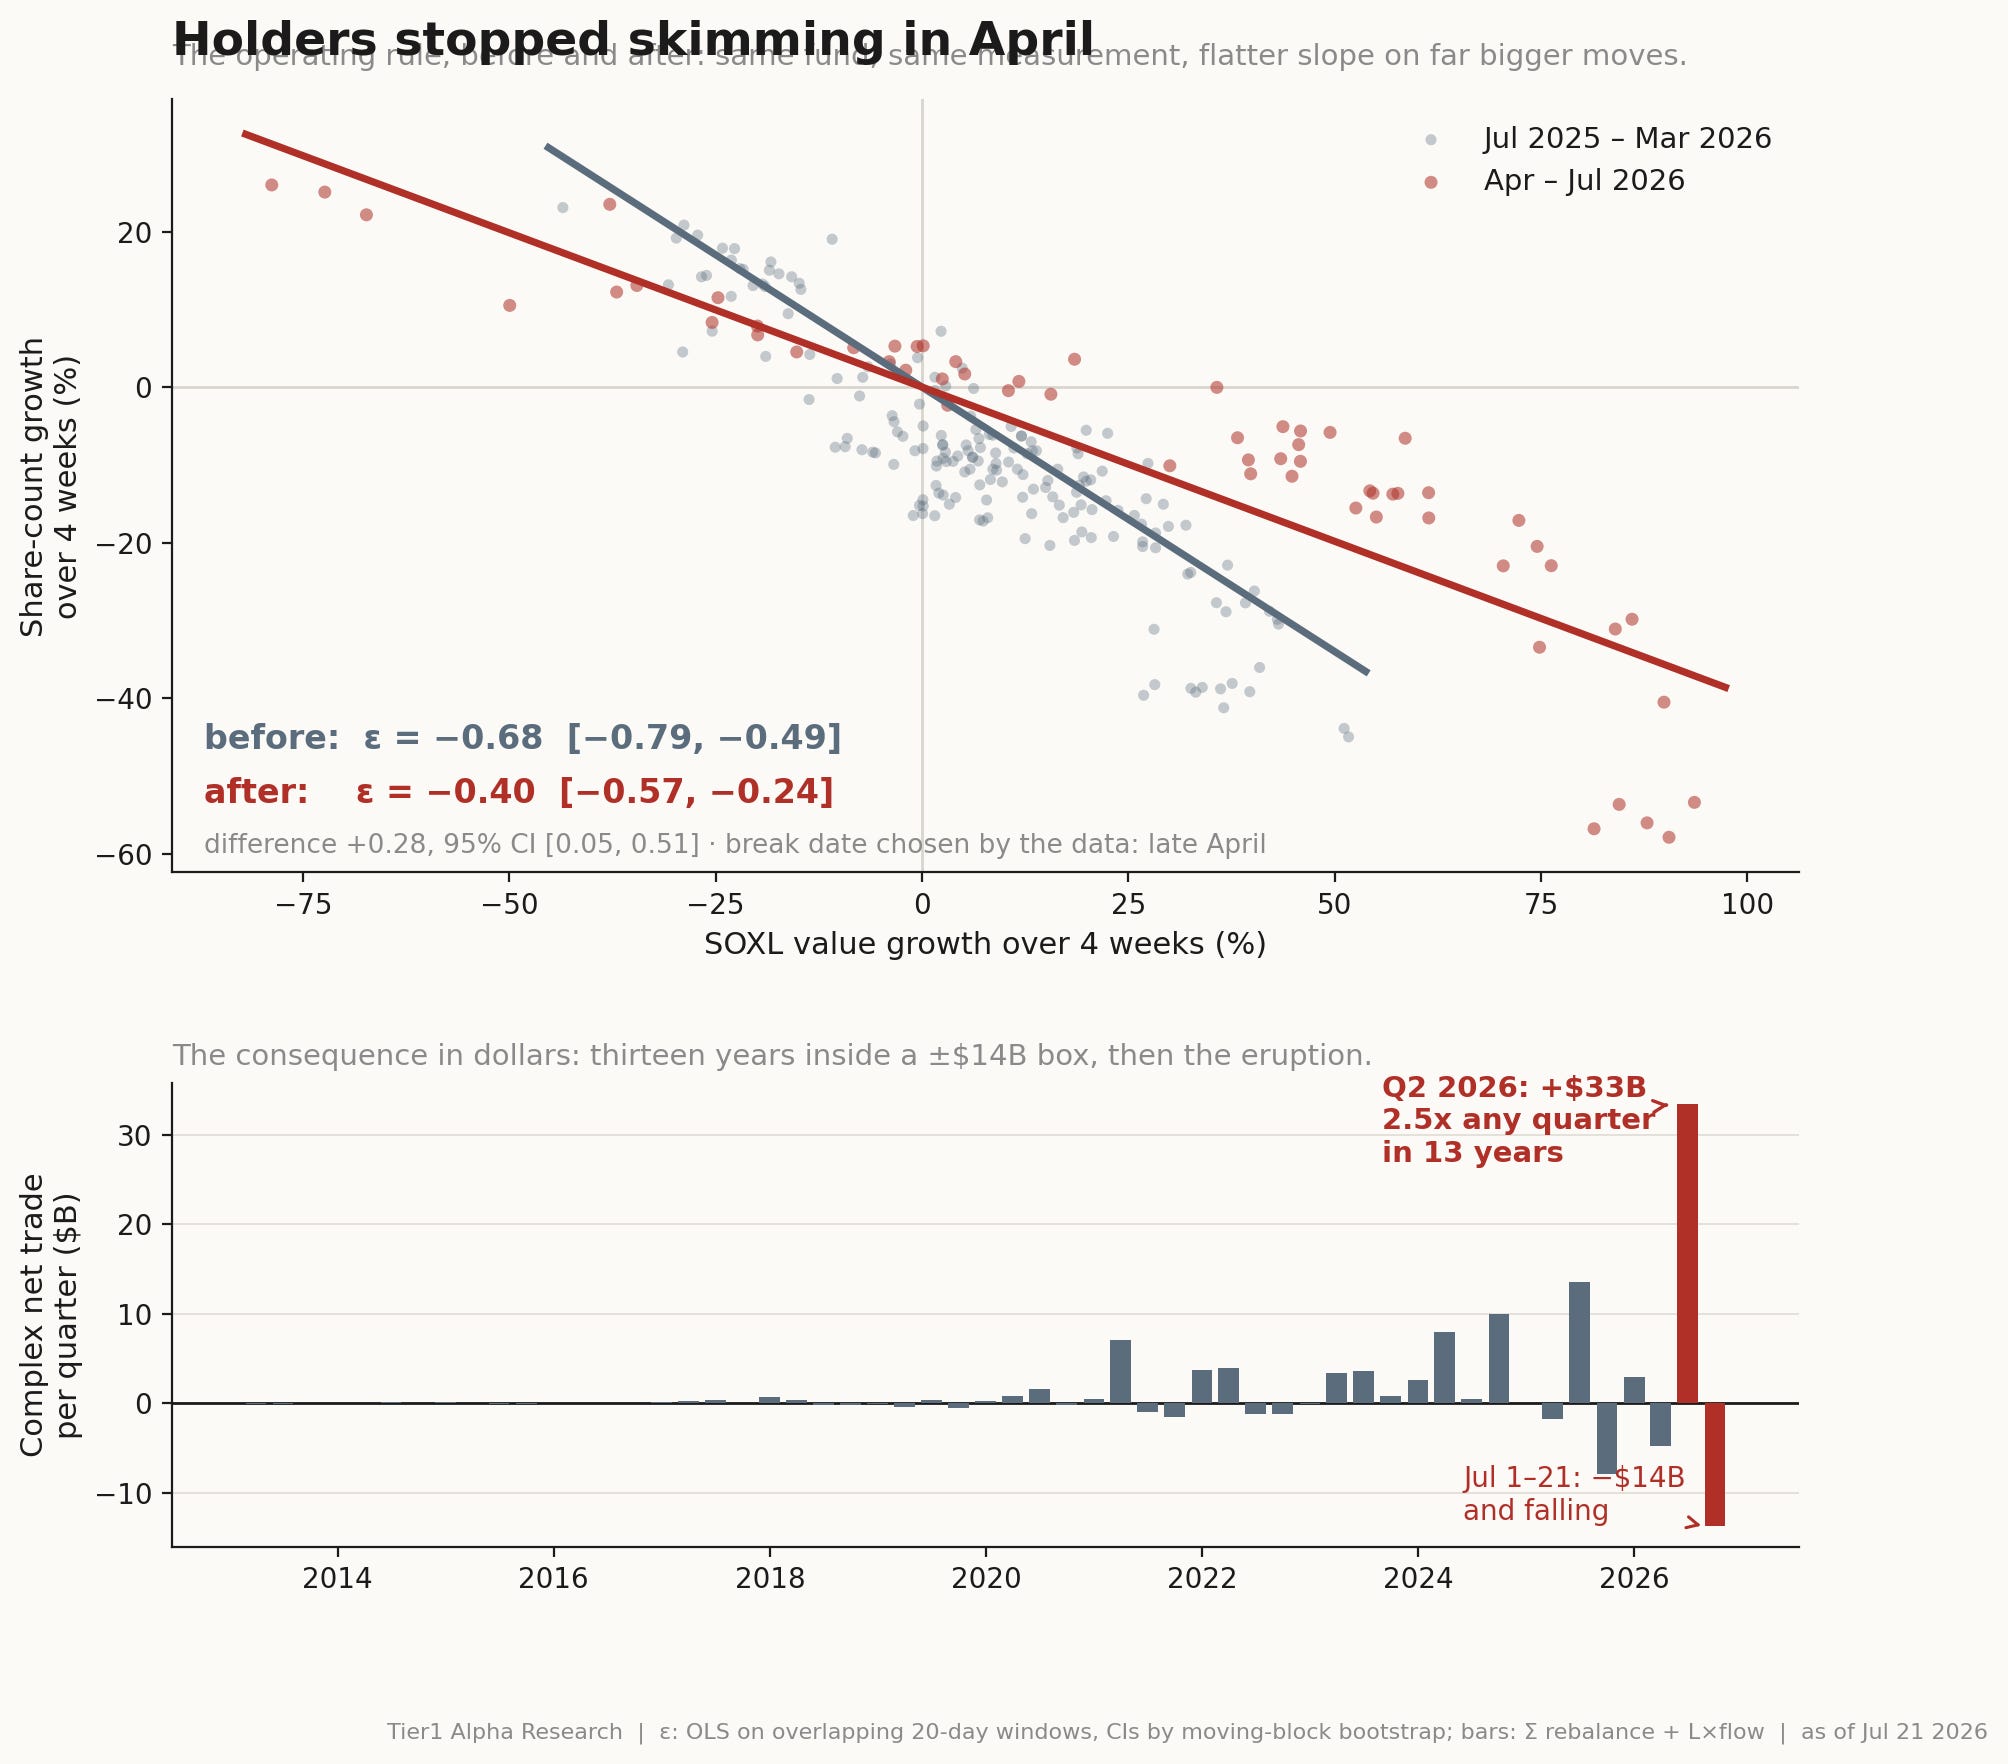
Realized volatility went from 33% to 55%. The day-to-day give-back weakened from −0.18 to −0.10. The weekly give-back vanished entirely, from −0.22 to zero. The share of trading days with moves larger than 3% went from 15% to 38%. And in July the machine showed its symmetry: as the index rolled over, the complex sold $13 billion in three weeks, momentum selling where the old regime would have been absorbing.
Was this retail investors catching the semiconductor bug and refusing to sell? Directionally yes, even though net dollars did not pour into SOXL during the melt-up; net redemptions continued through April and June. What changed is that the marginal holder stopped rebalancing, which is all the arithmetic requires. The clearest retail fingerprint arrived afterward. The first genuinely positive inflows of the entire year showed up in the first three weeks of July: dip-buyers purchasing a 3x product, at 60% underlying volatility, after the top. Those buyers face a 54% annual breakeven. They are feeding the standing wave from the long side now.
“If you're playing a poker game and you look around the table and can't tell who the sucker is, it's you.” — Paul Newman
